Inspired by a recent Reddit post about visualizing building ages in Amsterdam, I decided to try my hand at creating this style of map using D3.js. The city I chose to map was San Francisco, because at the time of writing no one else had done it yet.
San Francisco’s open data sources are not suited for building-level visualizations, and as I soon discovered, this was the main reason why no San Francisco building age map had been created yet.
Most of the useful information (such as the year built and the number of residential units) is associated with the parcel of land as opposed to the building itself. Meanwhile, there is no direct mapping for which building corresponds to which parcel of land, since some buildings may not be contained within one parcel.
I came across a paper that described this precise dilemma and suggested a simple solution, which I ultimately adopted: assign each building to the parcel containing its centroid.
Using this method I was able to associate each building in the building footprints dataset to the year it was built, using data from the land use dataset.
Loading and displaying such a large dataset was a huge challenge. The building footprints dataset contained detailed shapes of almost 180,000 buildings, and removing all the unnecessary columns only reduced it to 170mb from an original 230mb.
This caused very long loading times, and I very much wanted to avoid the user having to download such a large dataset to view the visualization. I also wanted to add an outline of San Francisco to the map, since the building footprints dataset did not include the coastline.
By using MapShaper, a handy tool I discovered when I made a map of Westeros a few years ago, I was able to combine the two GeoJSON files and re-export the combined file as a TopoJSON, which reduced the size to around 44mb.
A screenshot of the final product can be seen below (or click the link to see a live version of the SF building ages map).
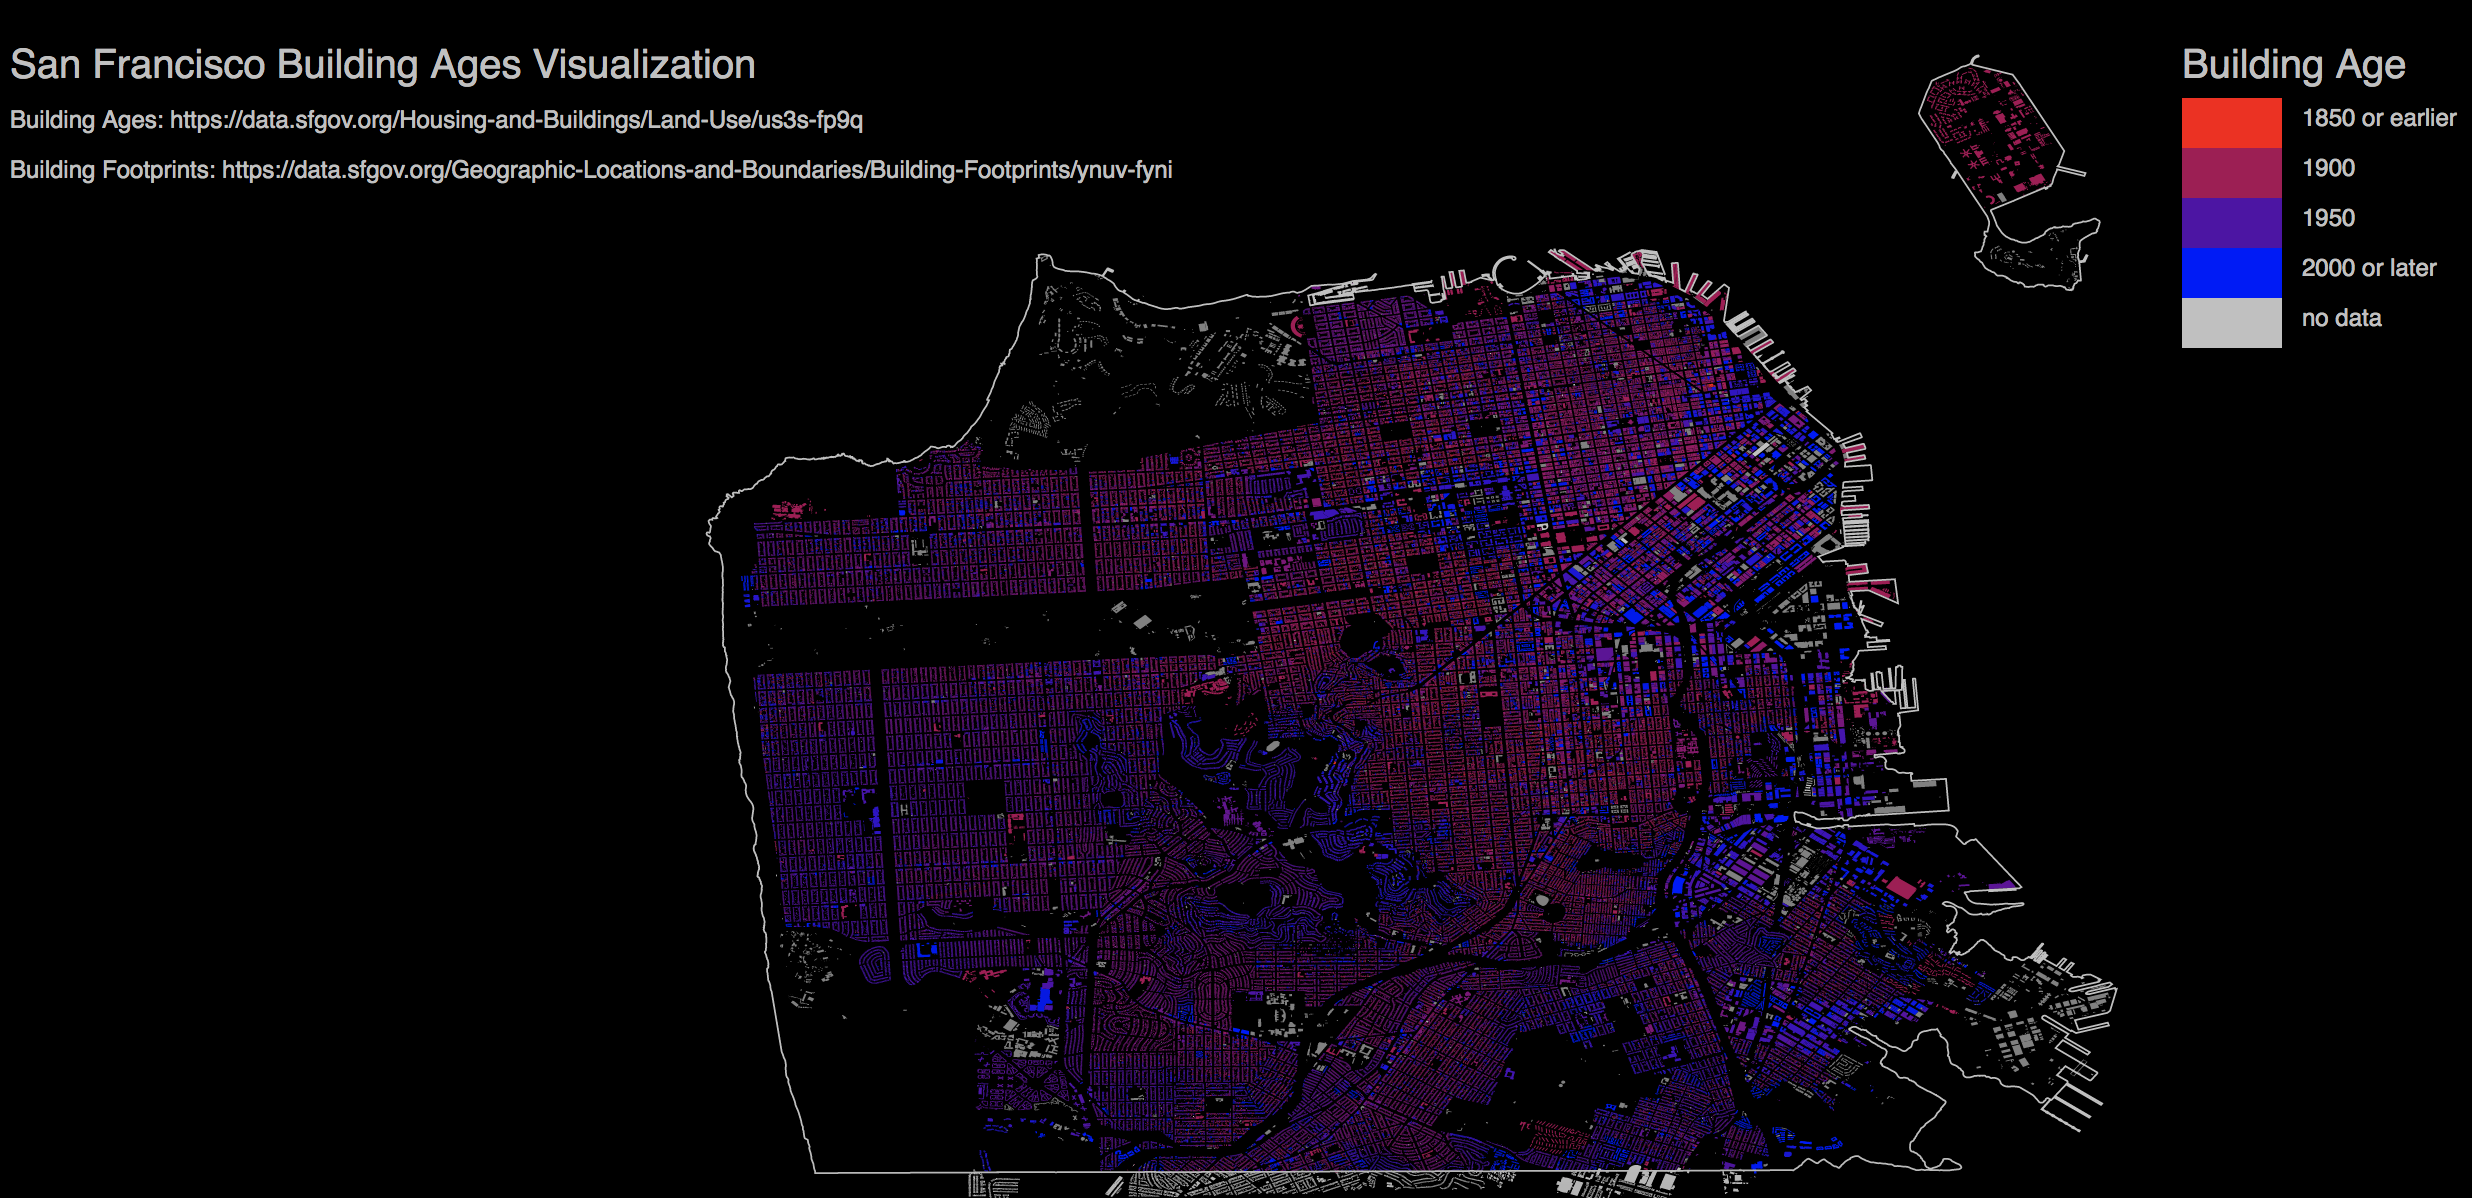
While the level of detail is fantastic, the irregular shapes of the buildings and the large amount of empty space actually make it harder to see trends across neighborhoods, so I wanted to try and make a version that showed this information more clearly.
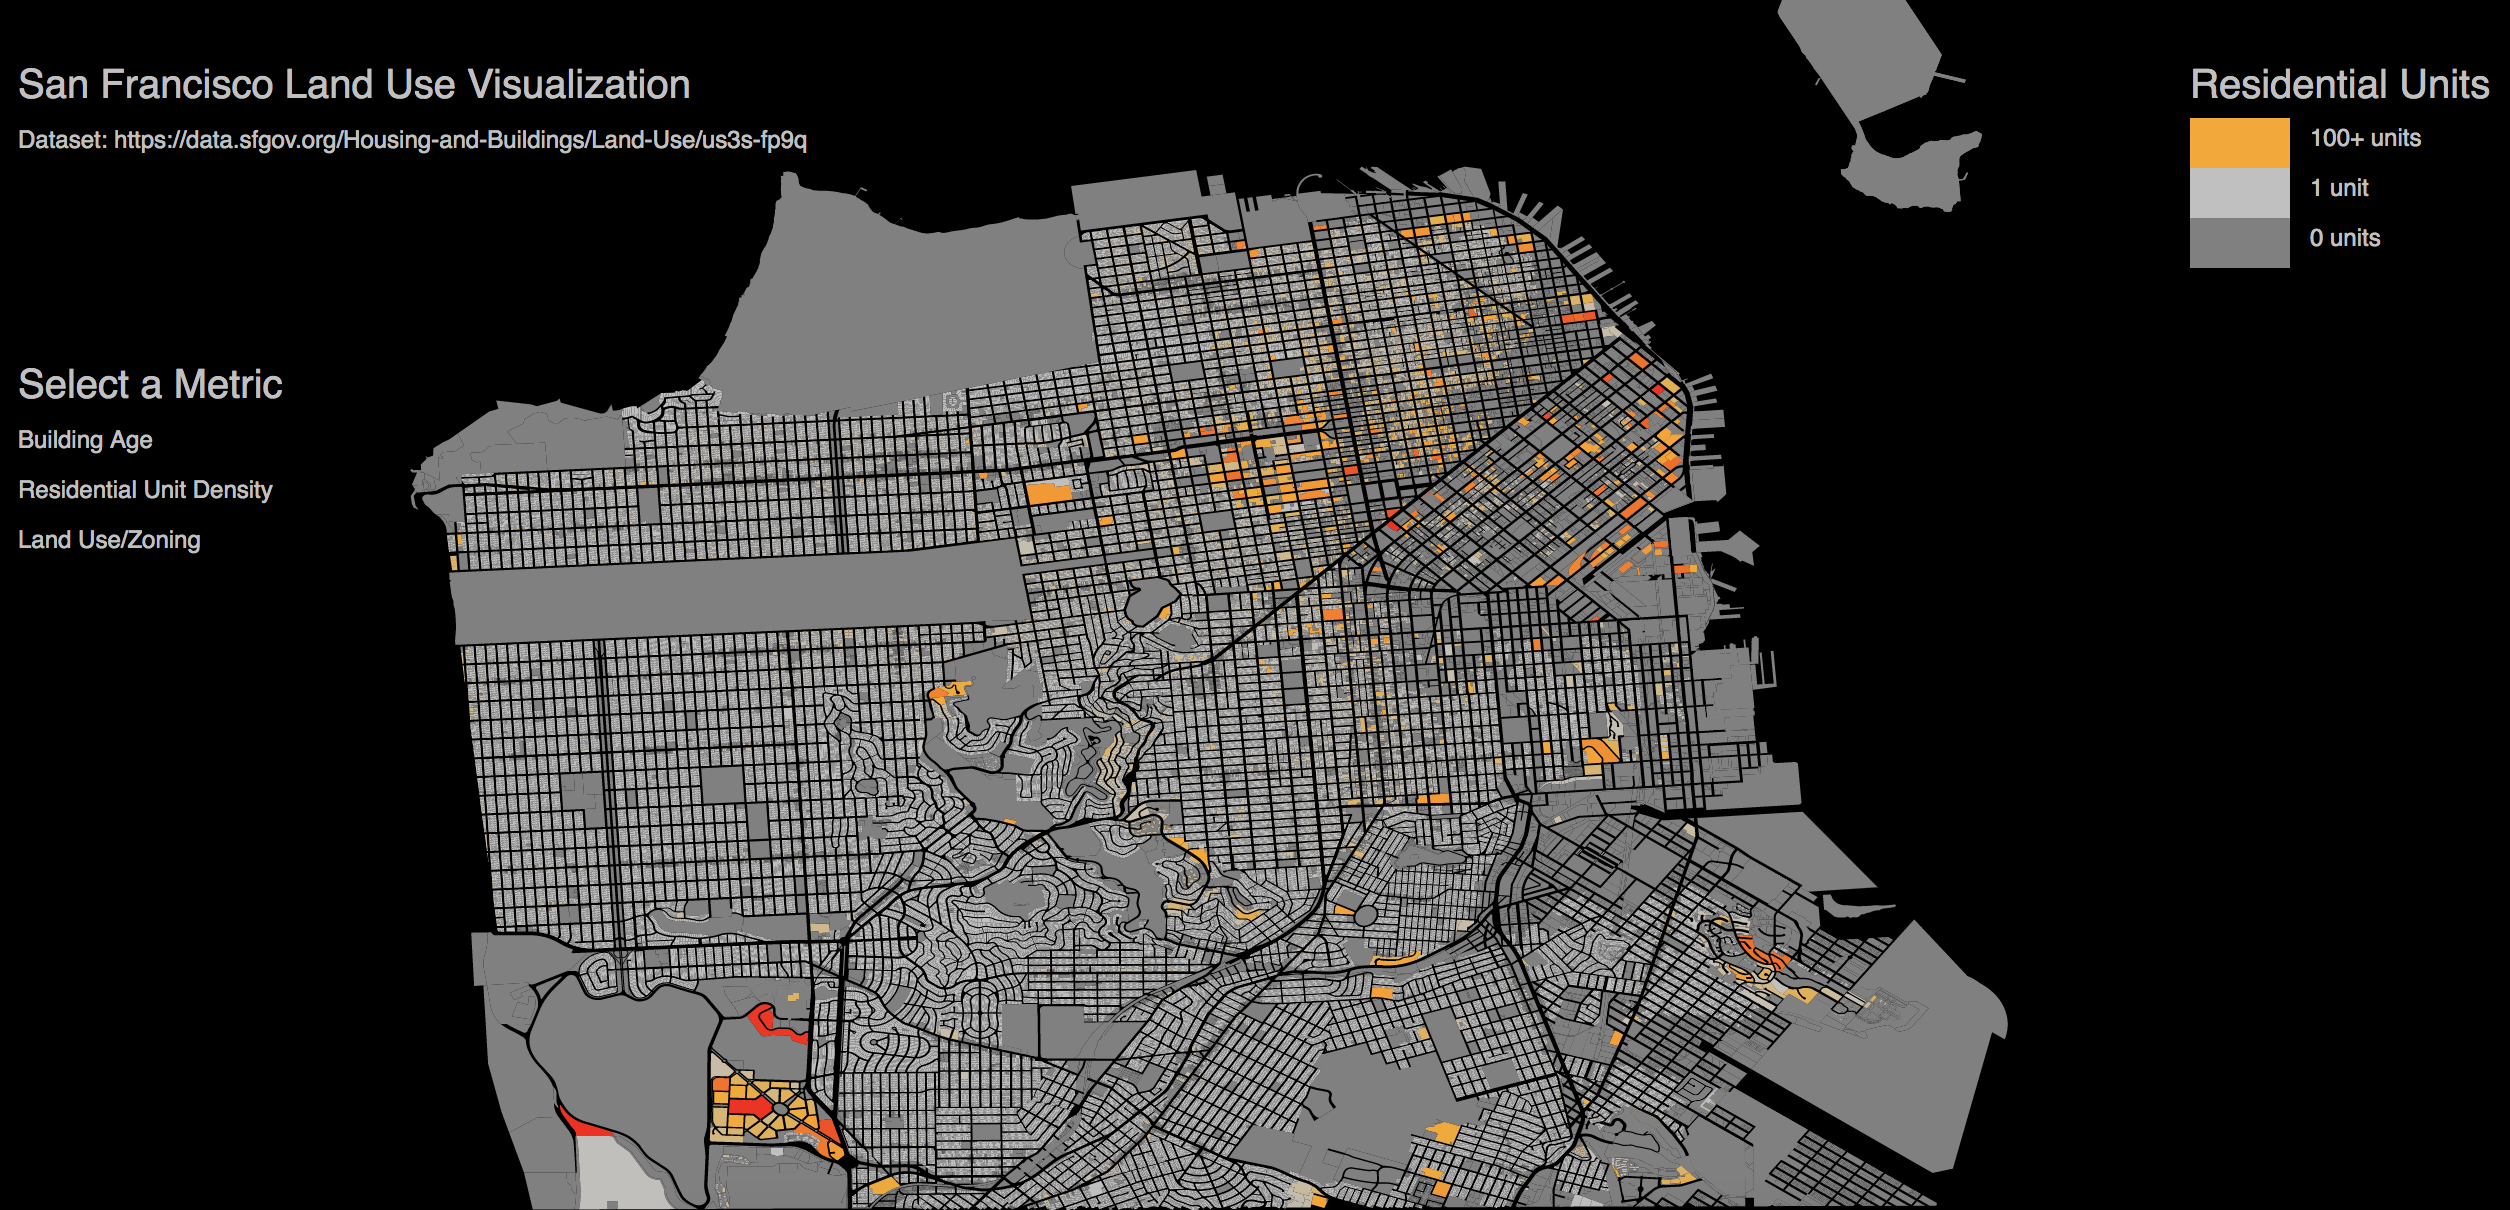
I decided to just visualize the parcels themselves without any buildings, since the parcel footprints fill more space. The final product was an interactive visualization that allowed users to see the year built, land use (zoning), and number of residential units for each parcel (see it live here: SF land use map).
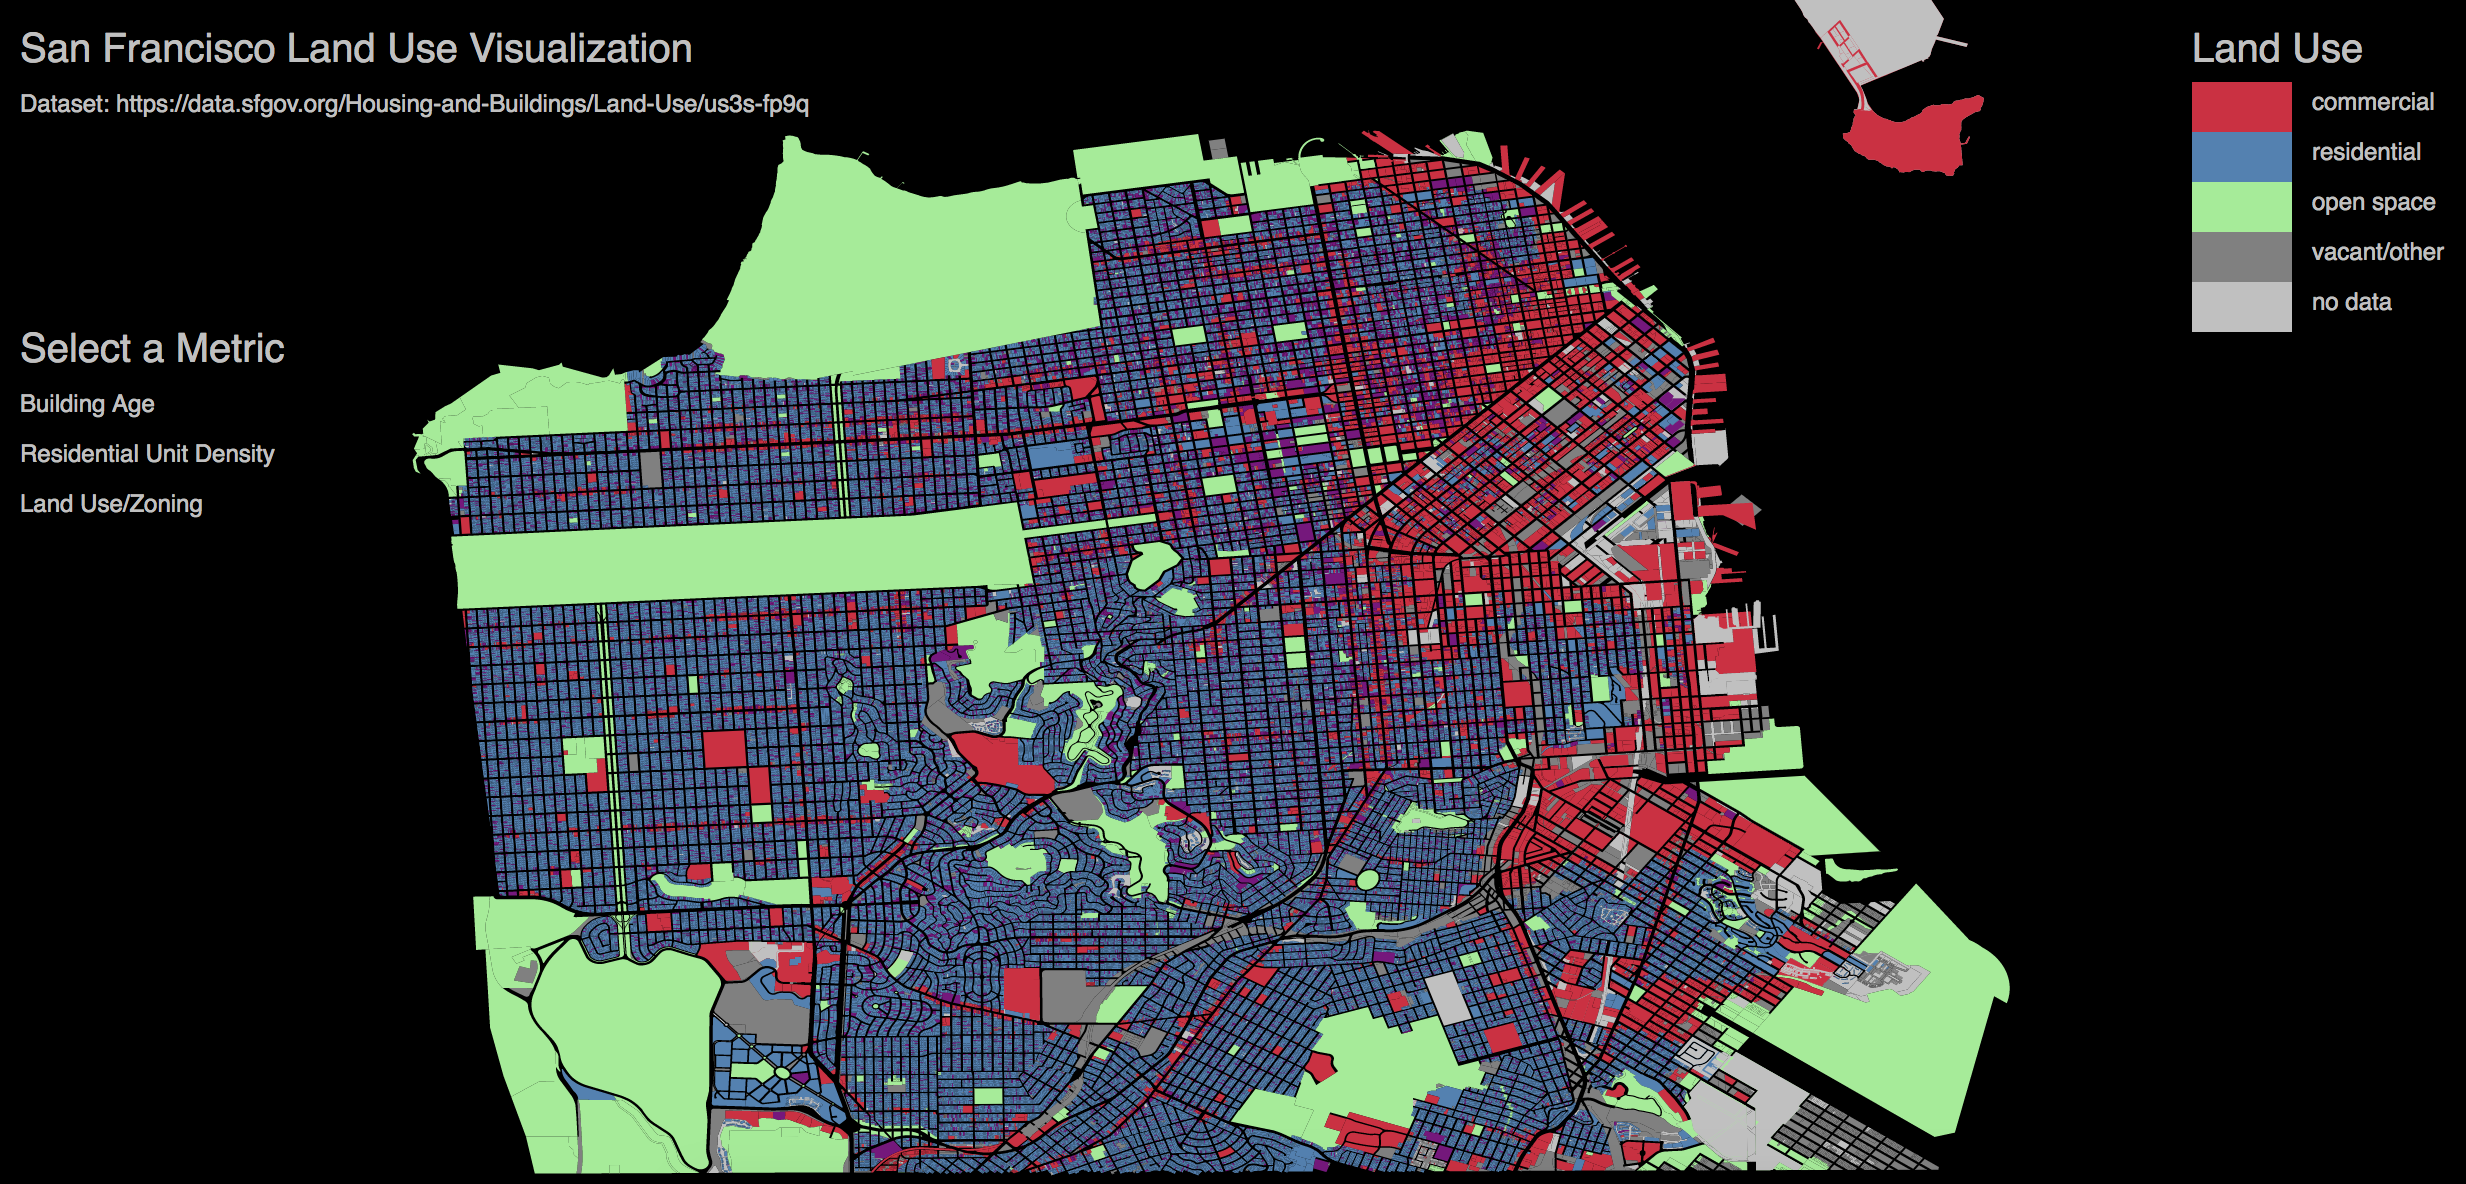
It’s obvious at a glance which neighborhoods were more residential and which were more commercial, and it’s easy to identify clusters of high density housing (corresponding with high rises near SoMa and, surprisingly, Lake Merced).
Additionally, the building age patterns that I observed in the building-level visualization are further emphasized here. Historic neighborhoods like Western Addition are full of red colored parcels, indicating older buildings. Meanwhile the areas with a lot of recent construction, such as SoMa, have a lot of bright blue.
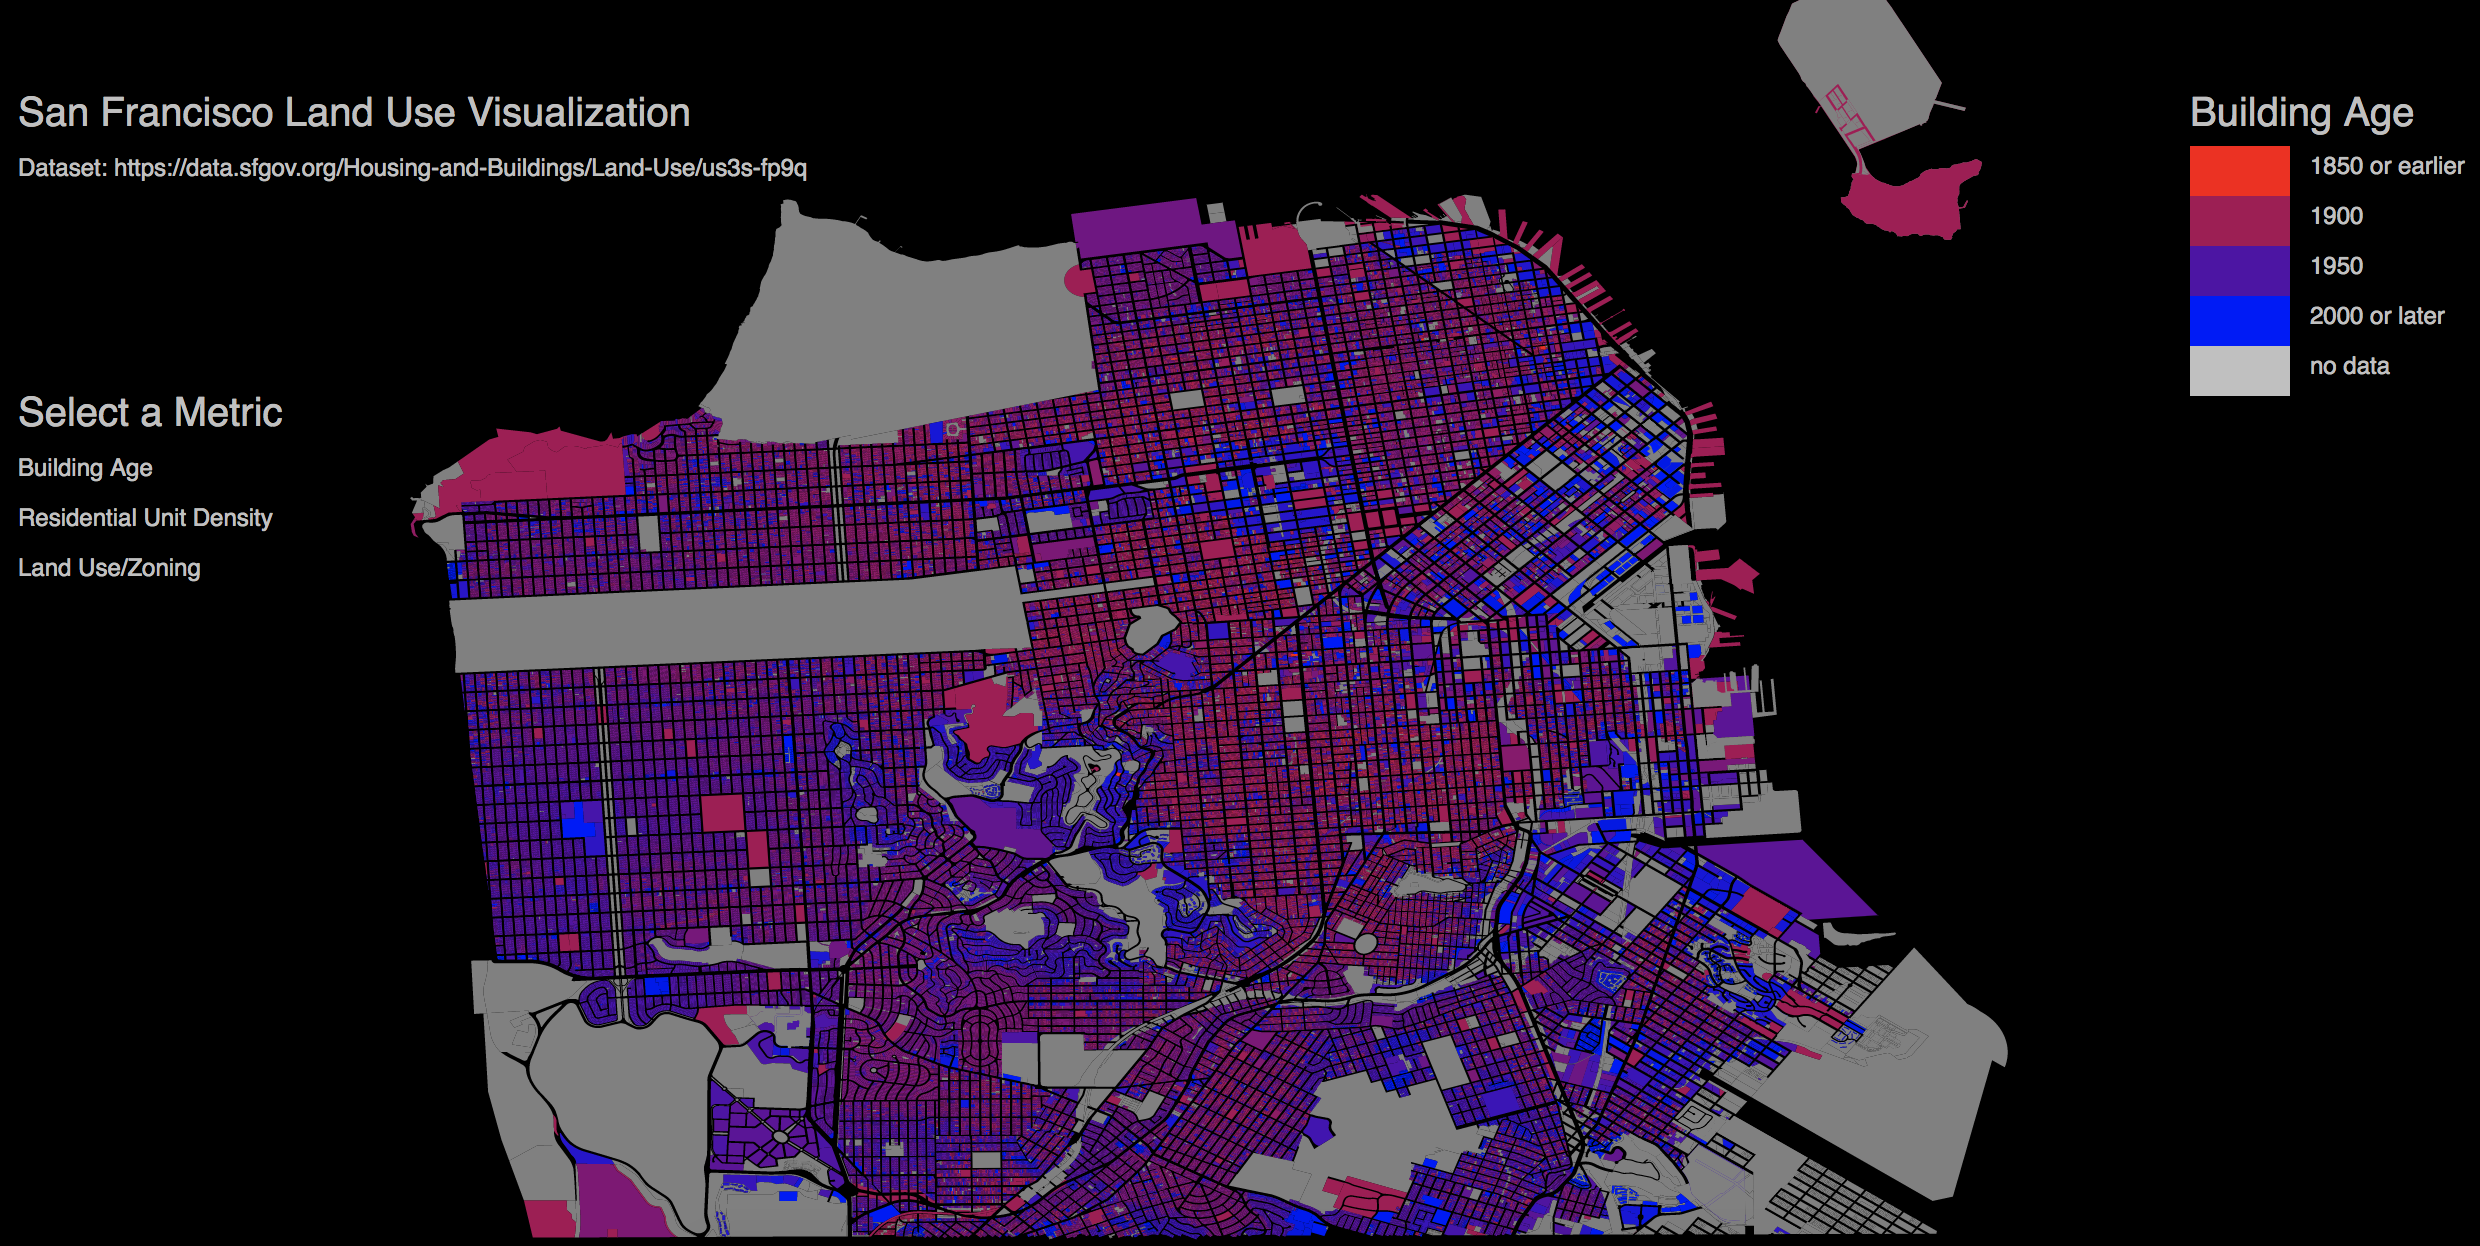
Interestingly, landmarks can be seen as well - the Palace of Fine Arts, built for the 1915 World Fair, can be seen as a uniquely-shaped, magenta-colored parcel at the top of the map.
D3 isn’t particularly well-suited to making maps, and performance suffers when rendering large GeoJSON/TopoJSON files. There isn’t a way to implement tiling or smooth zooming, both of which impact the usability of a map this detailed. In the end, I found that the best way to present high-detail maps in D3 is as static SVG visualizations, which allows the user to use the browser window to zoom in without pixelation.
Overall, I found mapping in D3 to be surprisingly fun, with an interesting set of challenges that led to interesting insights and workarounds.
I collected some D3 mapmaking tips and tricks for anyone that wants to try their hand at making maps with D3, which I hope will help people create more cool maps and visualizations of open data.