This post is a collection of common problems people will encounter while making maps using D3, and my advice for how to deal with them. I plan to make regular updates/corrections as my understanding improves.
Last update: 6/30/25
Geocoding #
Geocoding is the process of mapping addresses to their coordinates. It’s useful when you’re working with locations that aren’t readily available as coordinates, such as free-form survey data.
The best geocoding service is probably Google Maps Geocoding API, but that costs money after a free trial.
There’s a free alternative called Nominatim that uses OpenStreetMaps.
Tool: National Historical GIS Data Finder #
For sourcing historical records like census data and map boundaries for the US, the National Historical GIS Data Finder is your best friend. You have to manually select and download your dataset (it’s not a live API to query from), but it has datasets going back hundreds of years, many of which are difficult to source elsewhere.
You can access it here: NHGIS Data Finder
Tool: GeoJSONLint #
This handy browser-based tool can help you preview your GeoJSON and diagnose any issues with its format.
Tool: Mapshaper #
When working with geographical data, I often use MapShaper. It has both a web interface and CLI where you can upload files in a variety of formats, edit their layers and polygons, and re-export them in your format of choice.
Some examples of things you can do include:
- preview how two sets of shape data will look when combined
- simplifying shapes by automatically removing some percentage of vertices/edges
- manually select and delete certain features
- remove islands below a certain size
- import data as one format and re-export as another format
Large GeoJSON Files #
Depending on the level of detail, GeoJSON can get very large. For example, the GeoJSON containing land use information on each parcel of land in San Francisco is ~137mb. Since D3 visualizations are rendered by the browser, it forces the user to download a massive data file to view the visualization, which makes load times exceedingly long. This is something we want to minimize, and thankfully there are several ways to deal with this.
-
Reducing the amount of properties for each feature
A feature refers to some object on the map (like a building) that has a shape and some properties. Properties are like columns in a traditional CSV, they can hold data. For example, in the SF Land Use dataset, each parcel is a feature and contains properties like their age and zoning type.
Oftentimes, the datasets you download will have a lot of properties that you don’t plan on displaying, which can be removed to save on size. Applying this method reduced the SF Land Use dataset from 137mb to 98mb.
-
Compacting the JSON
JSON data is stored as text, and thus we can save on file size by cutting down the number of characters we use. For example, removing spaces after each colon or comma, or shortening the names of properties/features. The former can be easily done by loading the JSON into Python, then saving it with separators that don’t have trailing spaces. Removing whitespace reduced the size of the SF Land Use dataset from 98 to 93mb.
json.dump(data,f, separators=(',',':')) -
Simplifying the shapes
If you don’t need a high level of detail, it is possible to reduce the complexity of the shape data by removing vertices, or reducing the precision of the coordinates.
For example, if you’re showing a world map that isn’t designed to be zoomed in, then you probably don’t need to render all the tiny islands and coastlines in a high level of detail. One way to simplify a complex shape by loading it into Mapshaper, using the slider to set your desired level of detail, and re-exporting the file. Sometimes you can shrink the file by over 90%!
-
Converting to TopoJSON
GeoJSON encodes each shape separately while TopoJSON encodes each shared line once, so converting a GeoJSON to a TopoJSON saves a lot of space when there are many shapes with shared edges. This approach can lead to very drastic savings - the entire SF Land Use dataset can be represented by a 32mb TopoJSON, which is more than 75% less! Check out the link above for more details about the TopoJSON format.
Converting is as easy as loading the file into MapShaper and re-exporting as TopoJSON. The drawback, as I understand it, is that you can’t adjust the projection like you can with GeoJSON, so it is best to set your desired projection using a tool like MapShaper before you convert it.
Load Times #
Generally, page load time is related to the size of the dataset, and how much data processing/manipulation the visualization needs to do. Larger datasets take more time to load, and more display elements take longer to render and update.
As a rule of thumb, loading datasets with more than 25mb will lead to a severe and noticeable performance hit. The best option is always to shrink your dataset, but if that cannot be done, then adding a loading indicator/spinner can go a long way to making sure users don’t think your visualization is broken while it loads.
For visualizations using static datasets, loading and combining multiple datasets or doing preprocessing on the data in Javascript each time the page loads is wasteful. To optimize page load time, merge datasets offline and do preprocessing ahead of time whenever you can.
Non-JSON File Formats #
Map data doesn’t always come nicely formatted as GeoJSON or TopoJSON; sometimes they will come as shapefiles, which cannot directly be displayed by D3. To convert the data to a JSON format, simply upload it to Mapshaper and re-export it in your desired format. I used it once to convert a shapefile of Westeros into a format that can be displayed in D3 (the final map, if you’re curious, is here: Game Of Thrones Interactive Battles Map).
Scaling Issues #
This is most common when working with city-level GeoJSON data, which will appear as a tiny speck on the screen if the projection is not adjusted. This can be fixed by centering the projection on the city’s centroid, then zooming and offsetting appropriately.
D3 provides a useful fitExtent function, which projects whatever data you have into the desired bounds within the SVG, saving you the trouble of doing manual adjustments.
Note that most of the time TopoJSON already comes with a projection applied, so it is not possible to adjust the projection’s scaling. In this case, you can set the transform attribute using D3, or you can upload the file to MapShaper and export a new version with the desired width/height/scaling.
Country Centers #
When plotting data points on top of countries/states, at first glance it might be intuitive to calculate the centroid of the shape and plot the point there, but there are several problems to this approach.
Firstly, not all countries are contiguous and convex. In both of the example below, countries like Indonesia, Malaysia, and the Philippines have their centroids in the middle of the ocean, which can cause confusion because there are a lot of countries in that area. The centroid of the US is affected by Alaska and Hawaii: the centroid is somewhere in Canada when using the Mercator projection, and in Montana if using Equirectangular.
Centroids w/ Mercator:
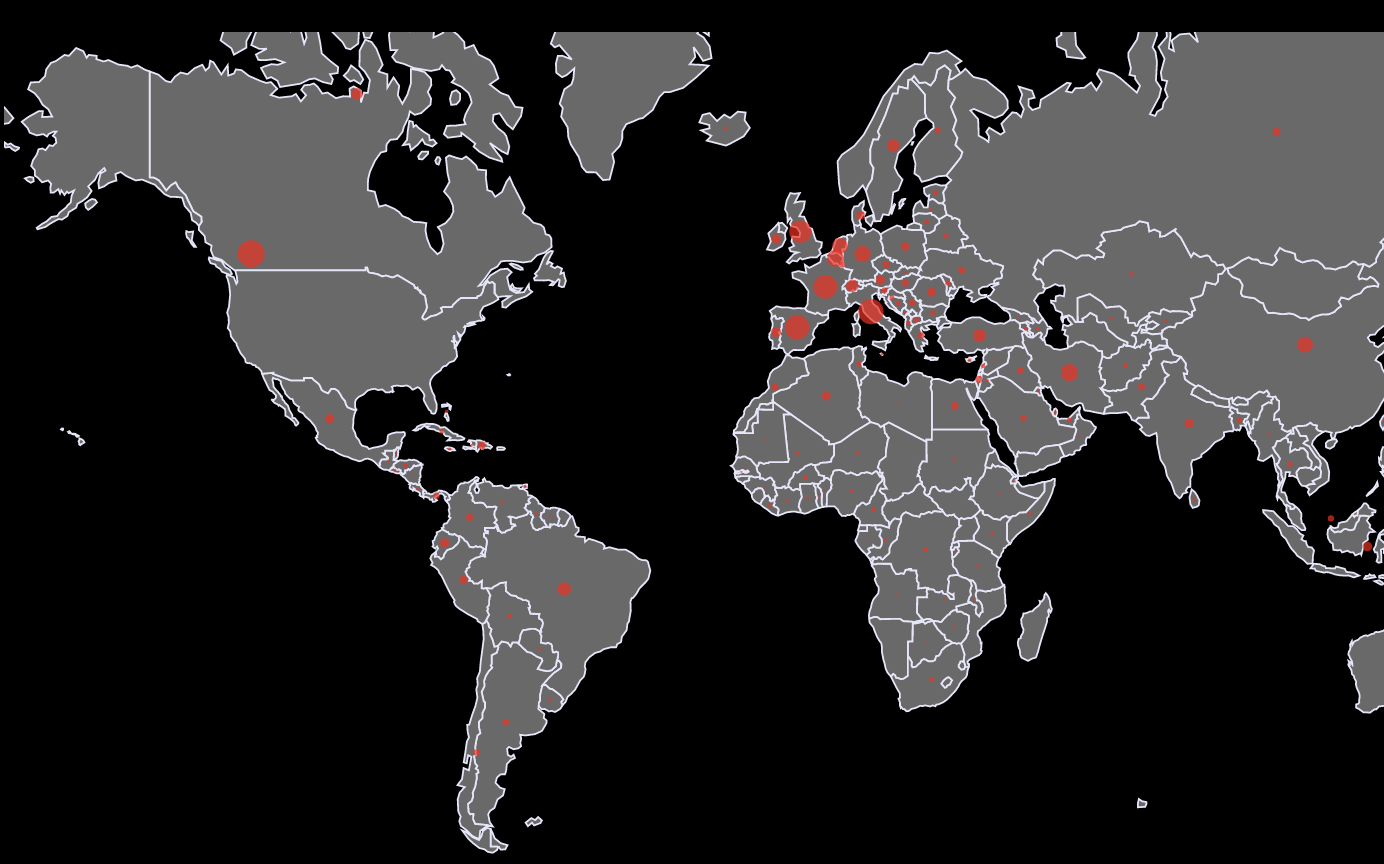
Centroids w/ Equirectangular:
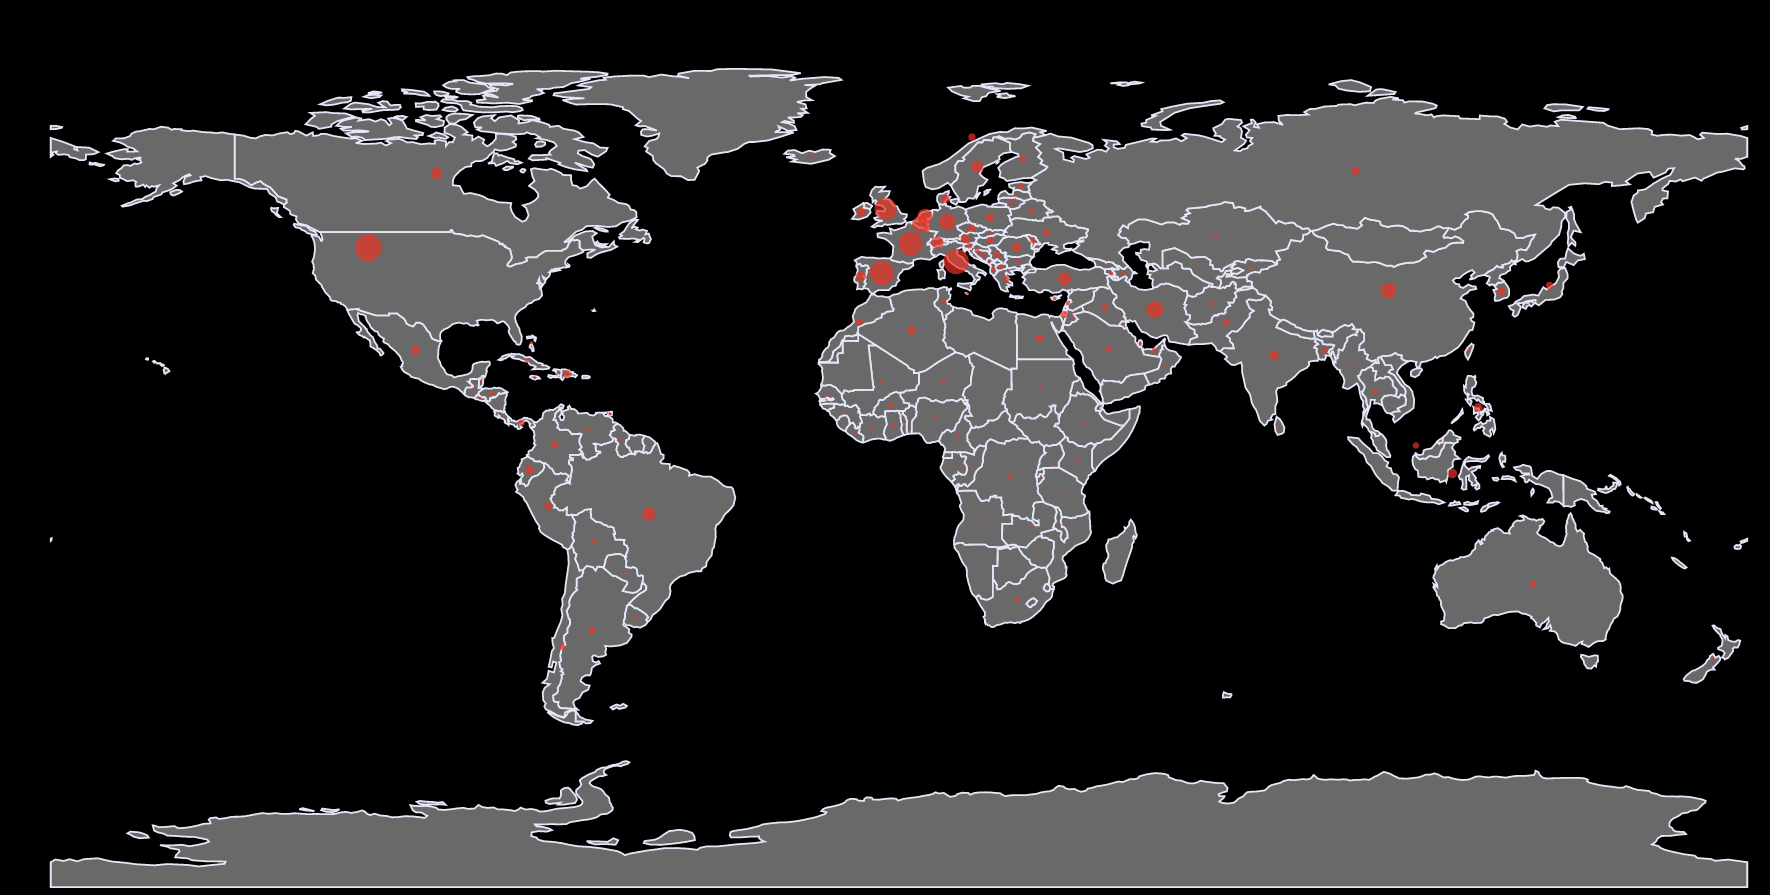
Beyond that, country centroids also have another issue when used for certain types of interactive maps. In maps where panning is done by adjusting the projection (making things that would normally disappear offscreen wrap onto the other side), countries at the edges of the map may not be displayed properly. If the projection was adjusted such that a country was cut in half by the edge of the map, the centroid of that country would not be placed at its geographic center; instead, it would be placed in the middle of the map.
The solution is to pre-determine nice-looking lat/long coordinates for country centers (there are also datasets available for this), and then join it with the GeoJSON feature for each country. The data points can just be displayed by applying the projection to the coordinates, without relying on re-calculating the centroid of each shape on the map.
Color Spilling - Incorrect Winding #
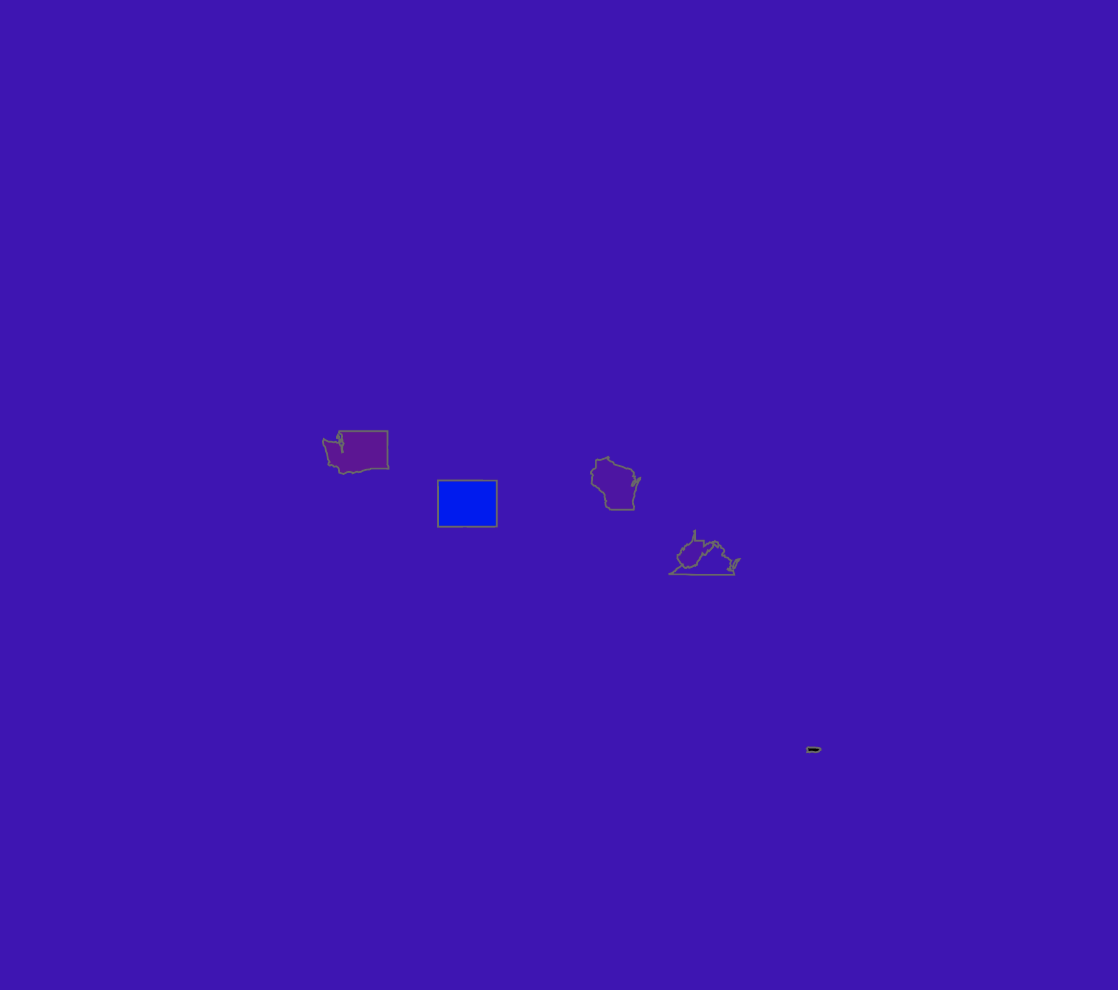
Sometimes you may encounter an issue where the color for a particular shape on a map “spills” out of the shape and fills the whole map.
This is caused by a winding issue with your GeoJSON file. D3 expects the coordinates on a path to be ordered in a clockwise direction, or what is sometimes called the “right hand rule”.
Your data source may have the coordinates ordered in reverse. To validate the winding in your GeoJSON, you can paste it into GeoJSONLint.
There are several online tools and libraries that can re-wind your GeoJSON correctly, like this one by David Bumbeishvili or this one by Mapster.
For larger files that aren’t compatible with browser tools, try using a library/CLI like geojson-rewind.
D3 Projections Returning NaN #
This is a pretty common gotcha when using projections for single coordinates, such as when calculating positions of tooltips or using the pre-determined centroids that I mentioned in the last section.
Trying to map a lat, long pair to pixel values with something like like d3.geoMercator()([10, -99]) will yield NaN for the y value.
This is because D3 projection functions unintuitively accept input coordinates as [long, lat], NOT [lat, long]. The solution is to flip the numbers - d3.geoMercator()([-99, 10]) will yield the correct pixel position for 10N -99W.
Zooming/Panning Behavior #
Maps with high levels of detail often benefit from the user being able to zoom and pan to focus on specific areas of the map.
There are 2 ways to implement zooming and panning:
-
Translating and scaling the shapes using d3-zoom
This might be laggy if the map is very complex, but it is possible to work around this by tiling the background.
-
Adjusting scaling/offset for the projection
The offset of a projection can be conceptualized like adjusting the view by rotating a globe. This approach has the benefit of the map not having any edges, but it only works for world maps.
There are 2 different approaches allow the user to zoom into a map; which one is better depends on the use case. I’ll describe the approaches below using a hypothetical world map visualization:
-
Click to Focus
When the user clicks on a country, the map zooms in to that country. When the user clicks a different country while zoomed in, the map pans to the new country. When the user clicks the country that is currently being focused, the map zooms out. This approach is best for choropleths and things that have distinct items that users would want to click and focus on.
-
Free Panning and Zooming
This approach allows the user to freely pan by dragging and zoom by scrolling. This is preferred if the data is unevenly distributed (dense in some areas but not in others) or if there isn’t any geographical unit that the user would logically want to click on.
Zooming/Panning Performance #
For simpler maps with fewer shapes, zooming is totally doable by using translate/scale transformations on your shapes. Unfortunately, when the number of shapes gets large, it becomes very difficult to have smooth zooming behavior using the standard technique.
Here are some features that have a lot of negative impact on zooming smoothness - they should be avoided if possible.
- filling shapes with images
- layering shapes
- semi-transparent fill
Tiling #
For high-performance zooming and panning, tiling can be used. This is the technique that software like Google Maps/Mapbox use, to make zoomable & pannable slippy maps. Basically, the map is broken up into a grid of images (tiles), and only the part that is currently being looked at is rendered.
D3 has a library called d3-tile that can be used tiling, but as far as I know the background of a map must be an image (you can’t tile SVG shapes).
That means that it is best to use an image for the background, and draw the lines separately. Render the lines without fill as you normally would, and tile the background. Note that this technique is better for rendering points/lines on a map, and would not work for choropleths.