#DuBoisChallenge2024 using D3.js, by Danny Yang.

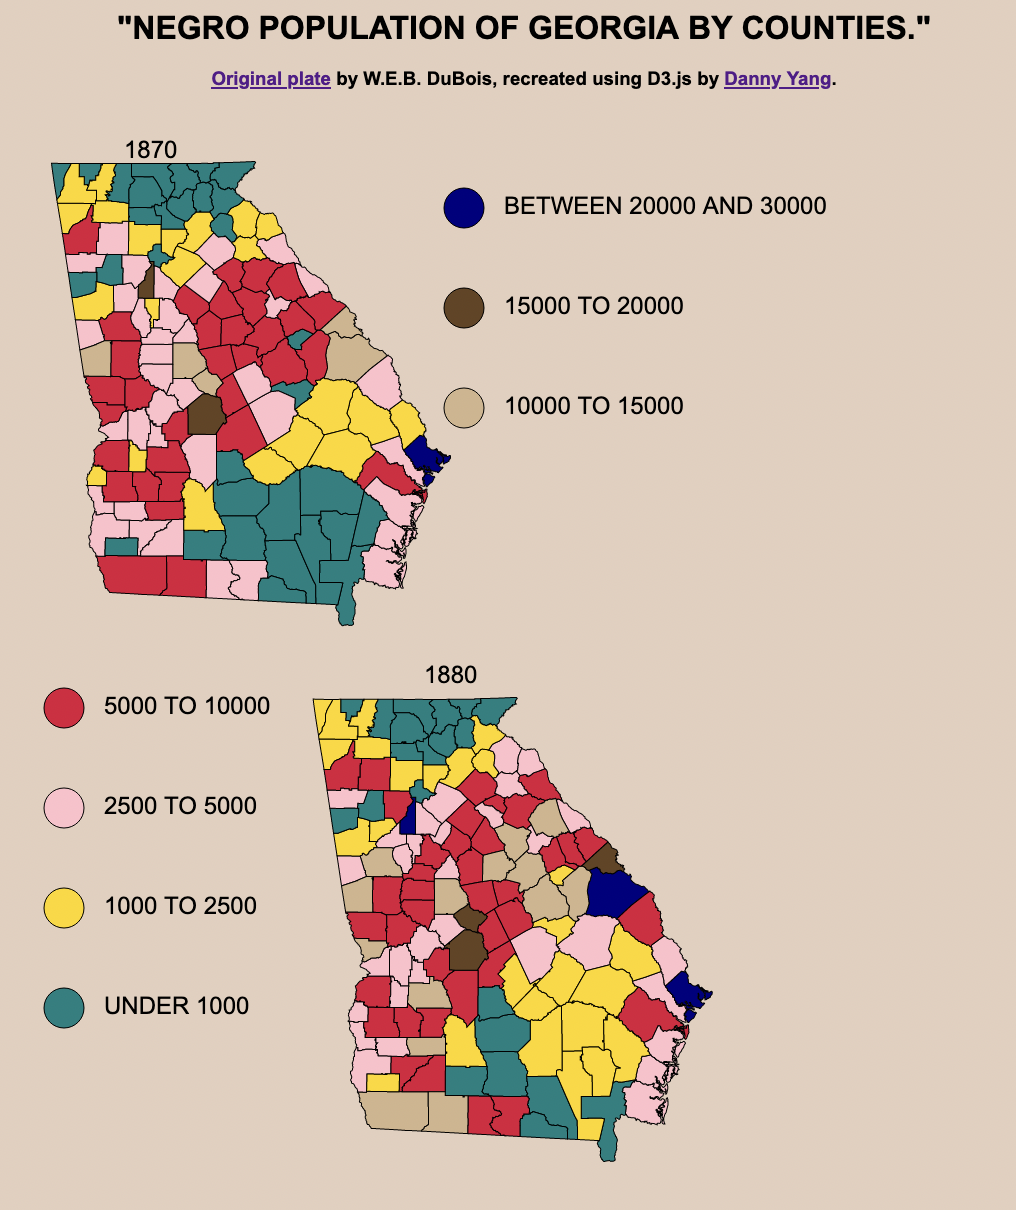
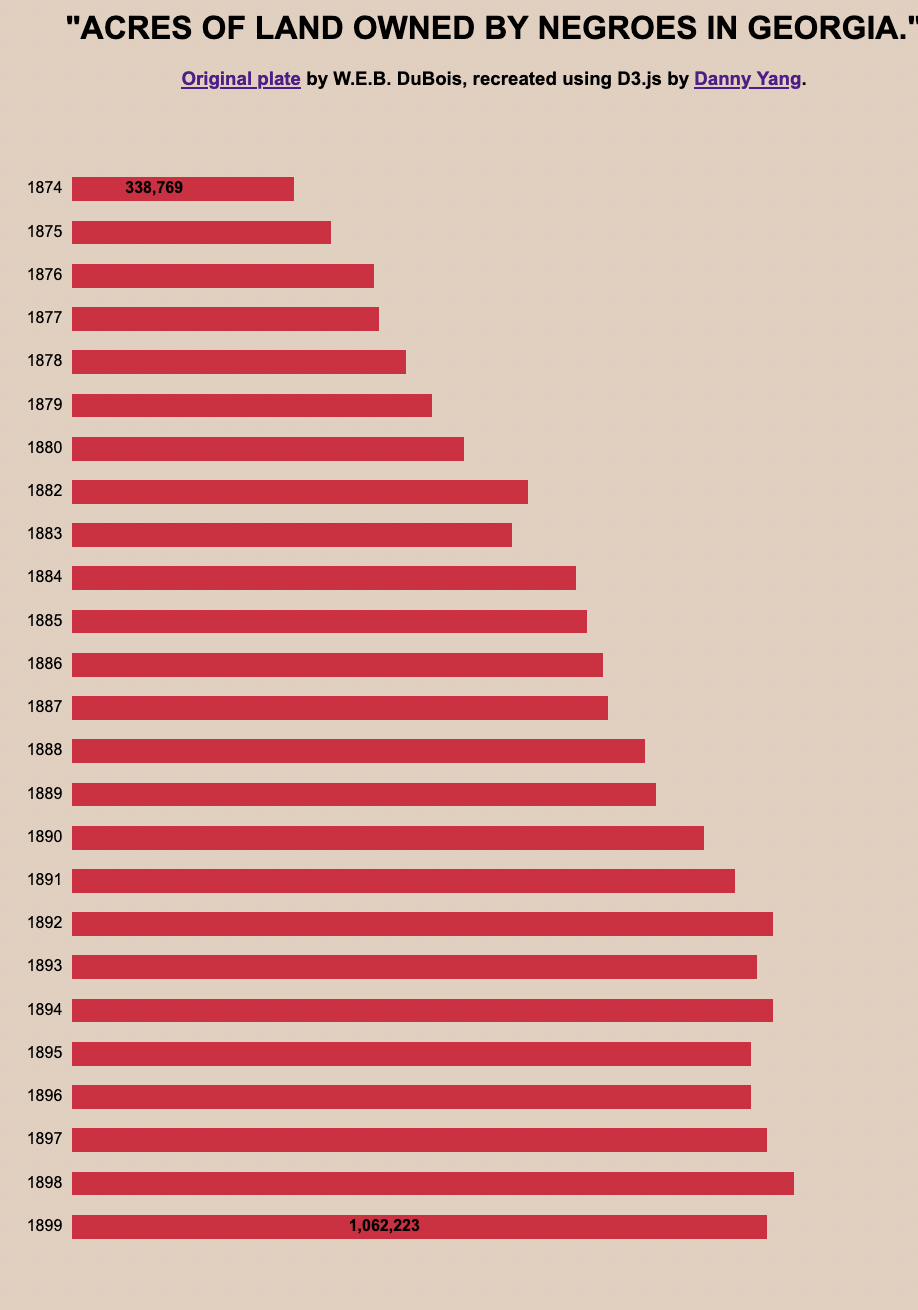
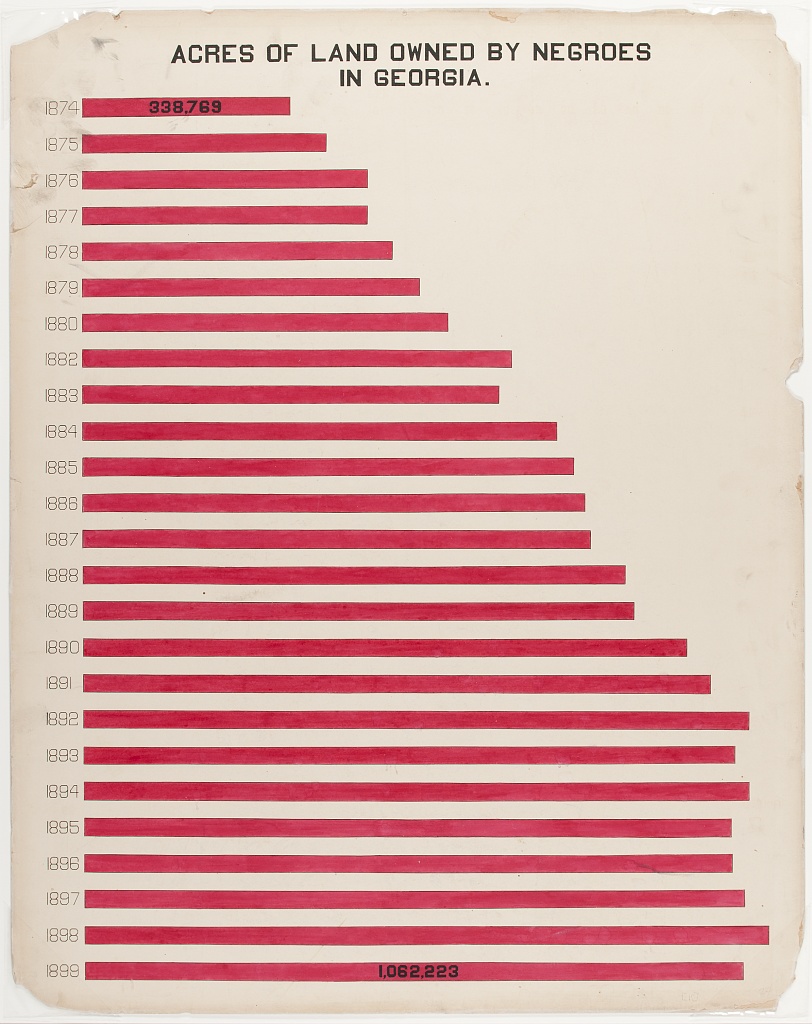
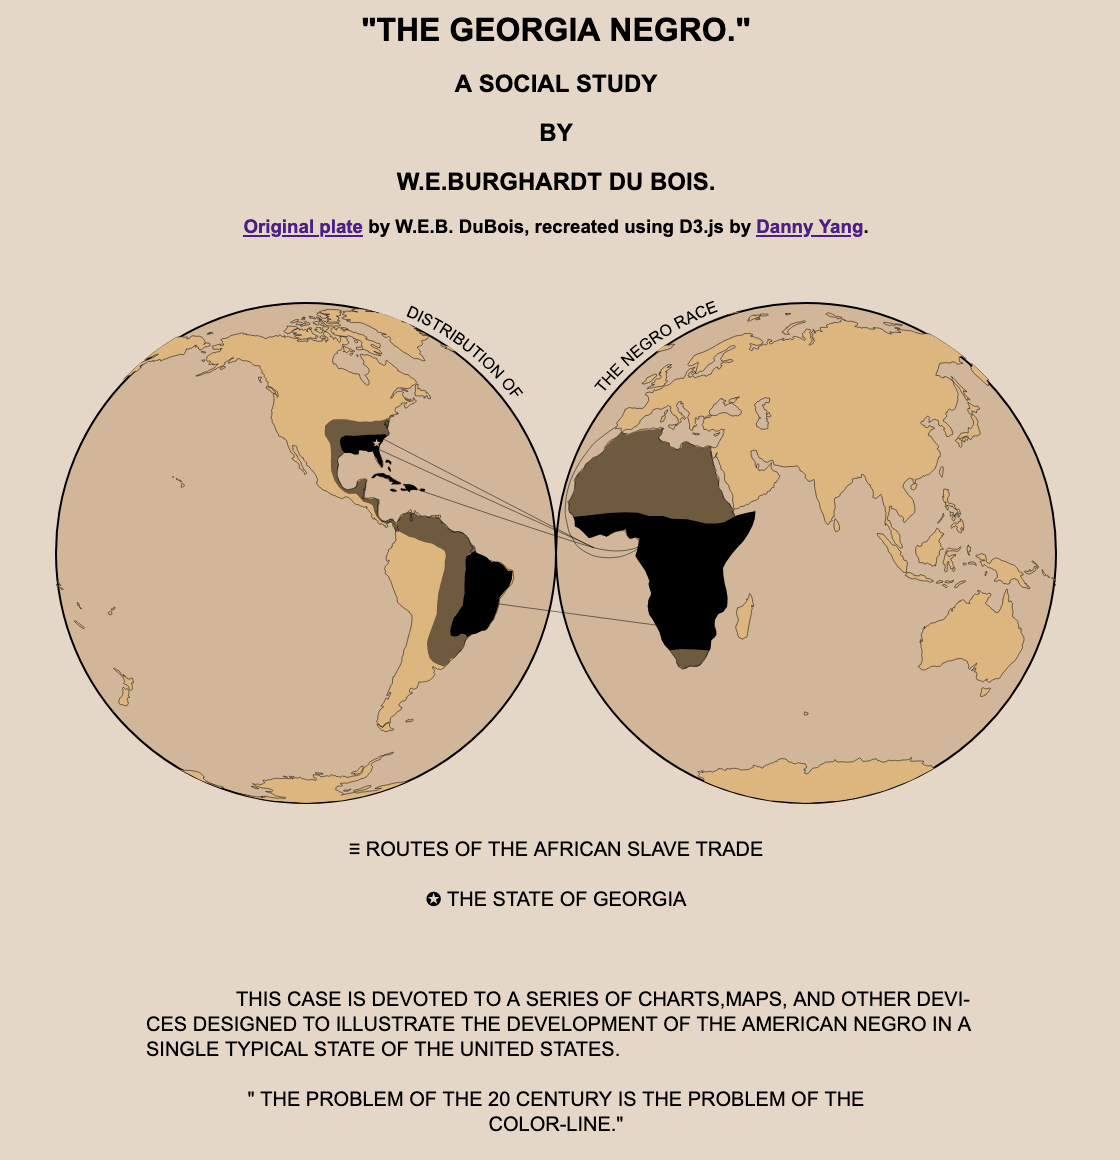
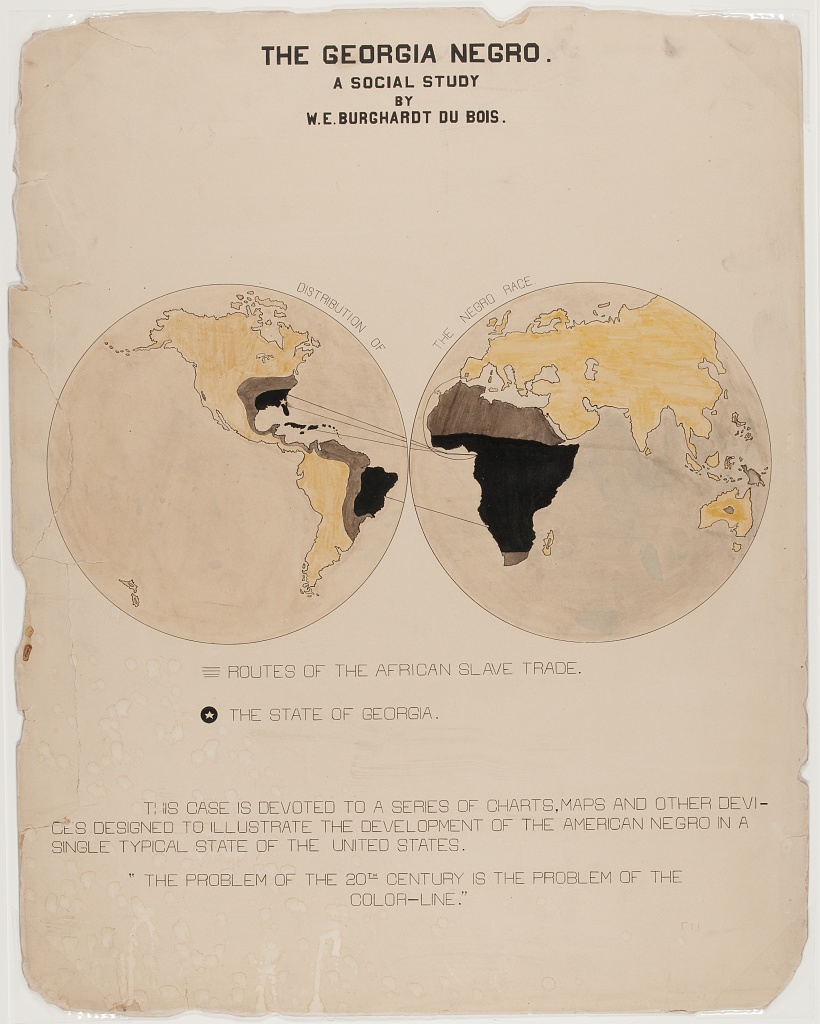
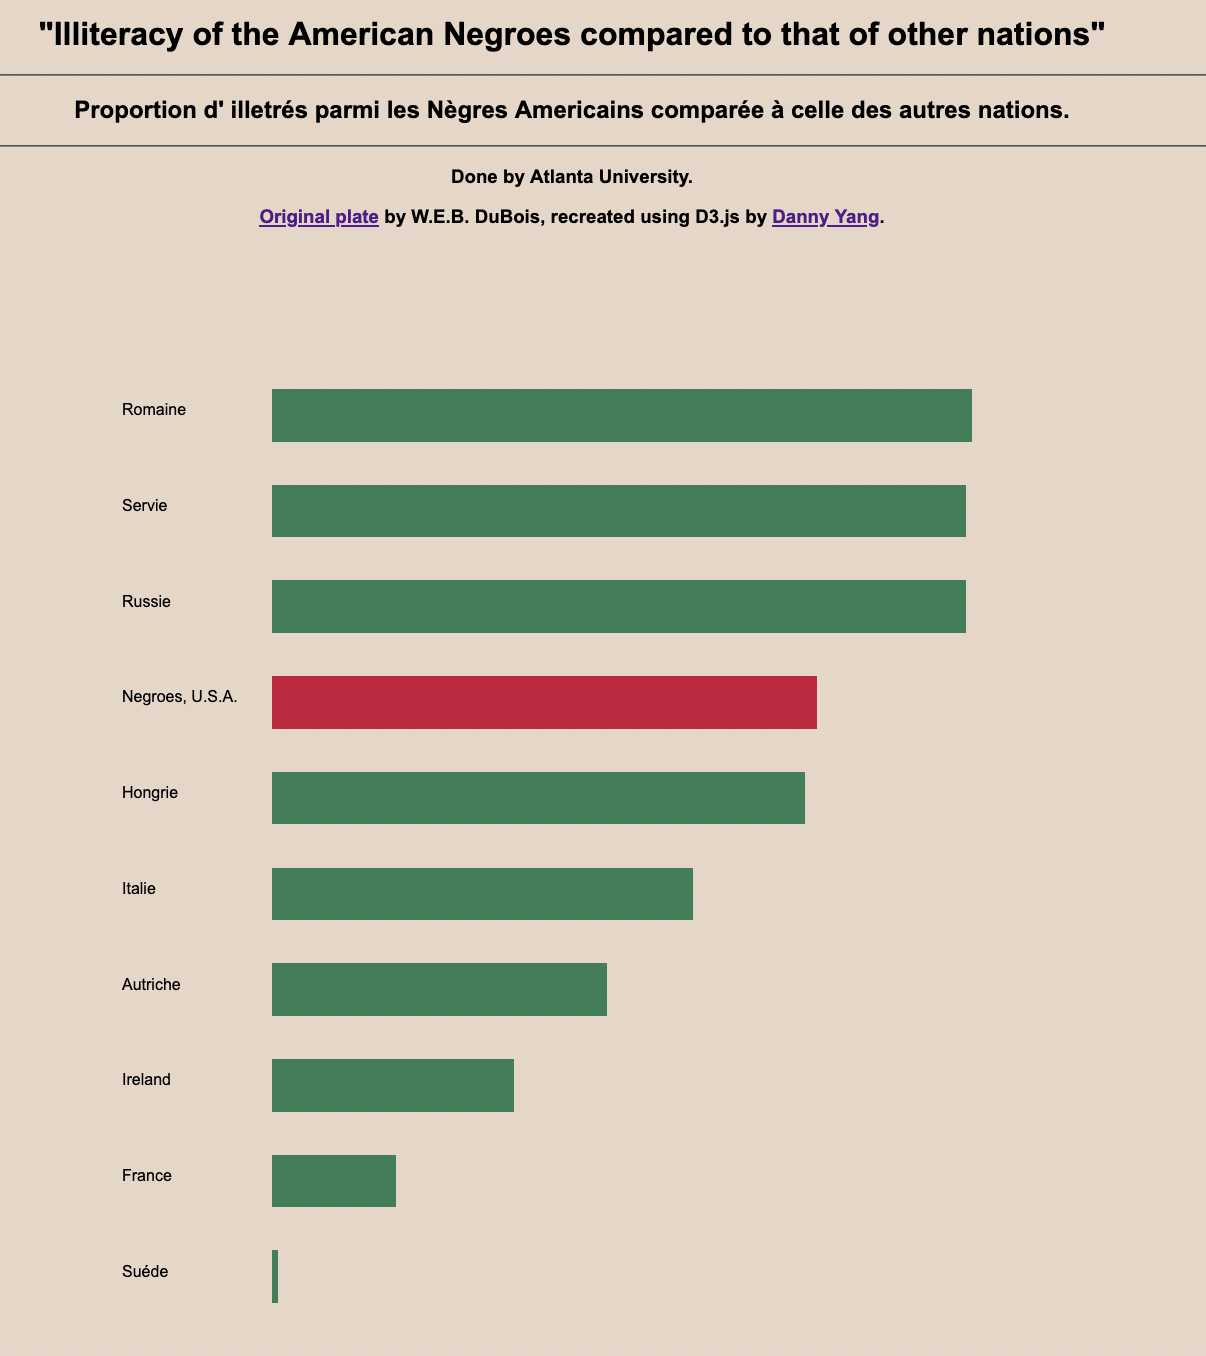
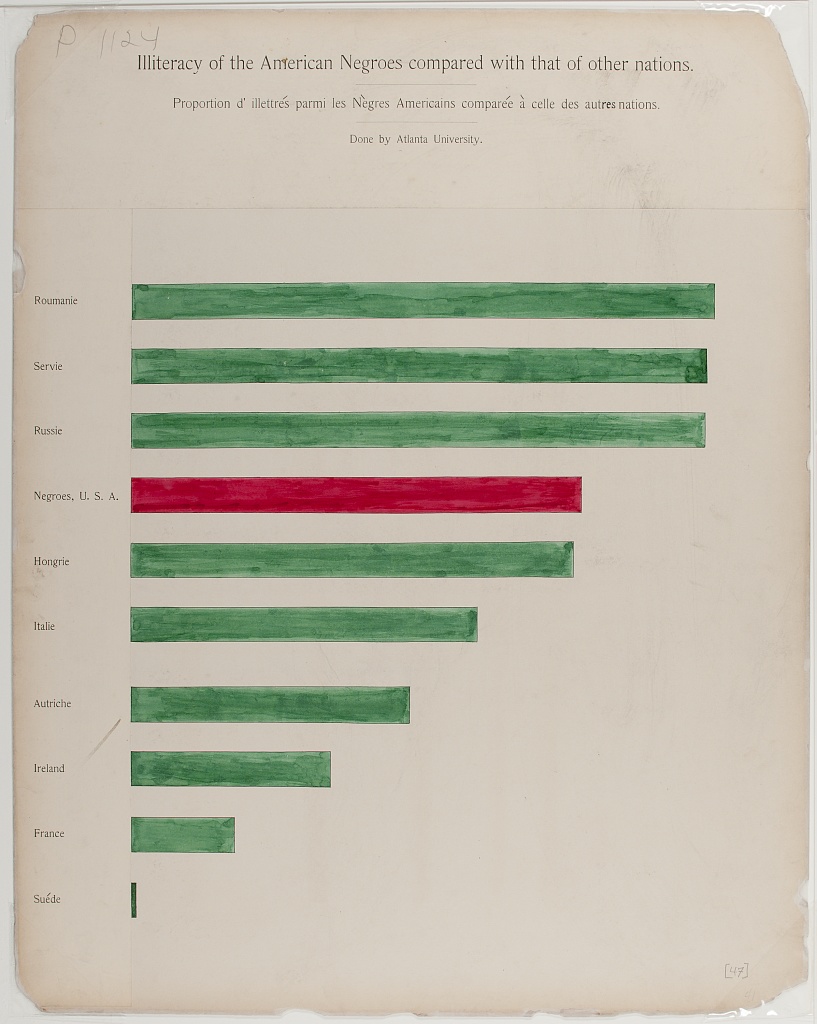
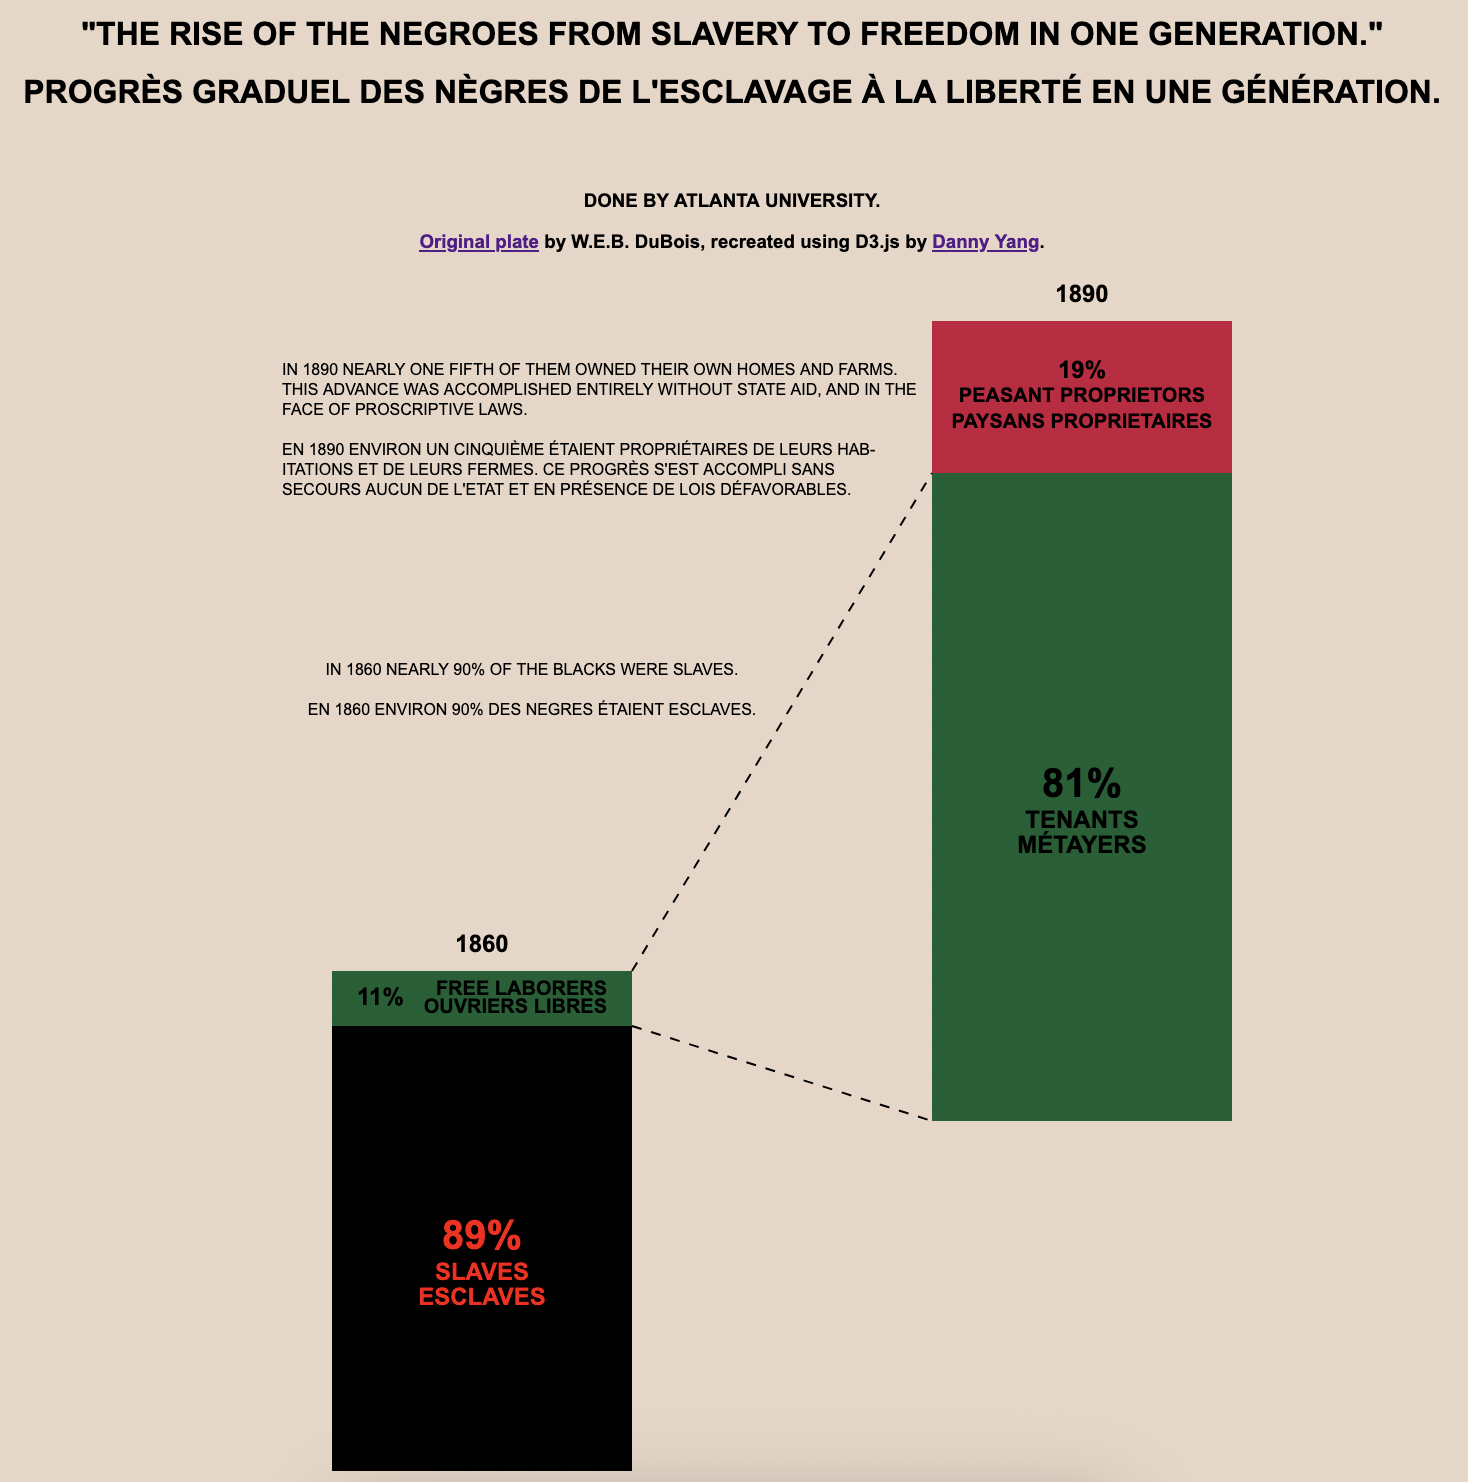
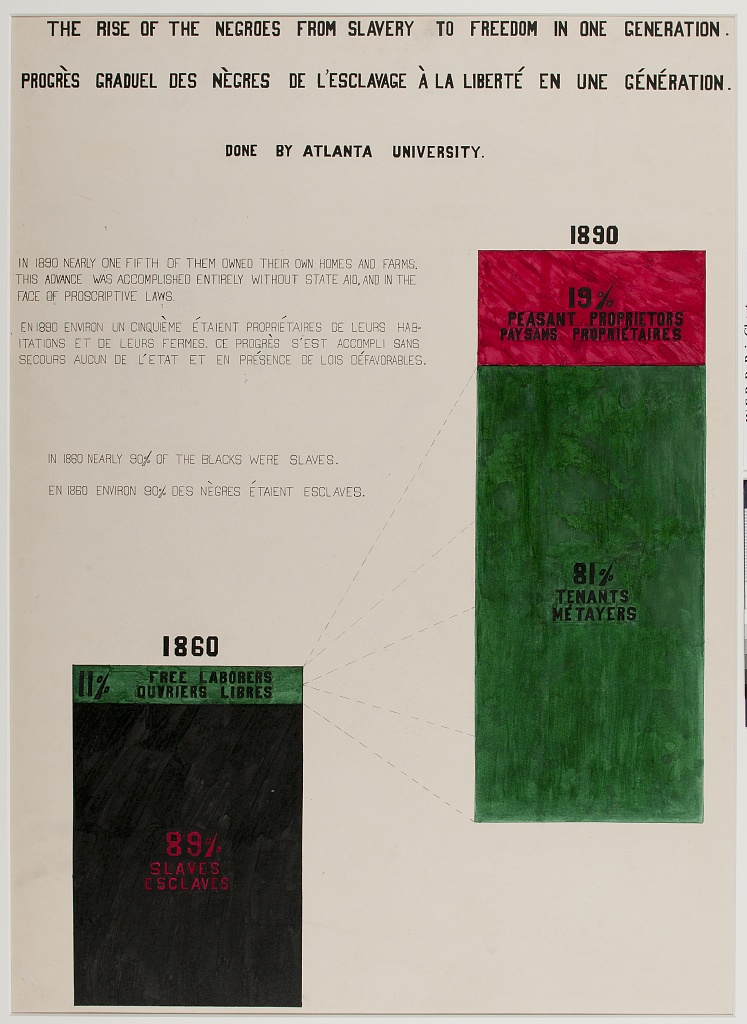
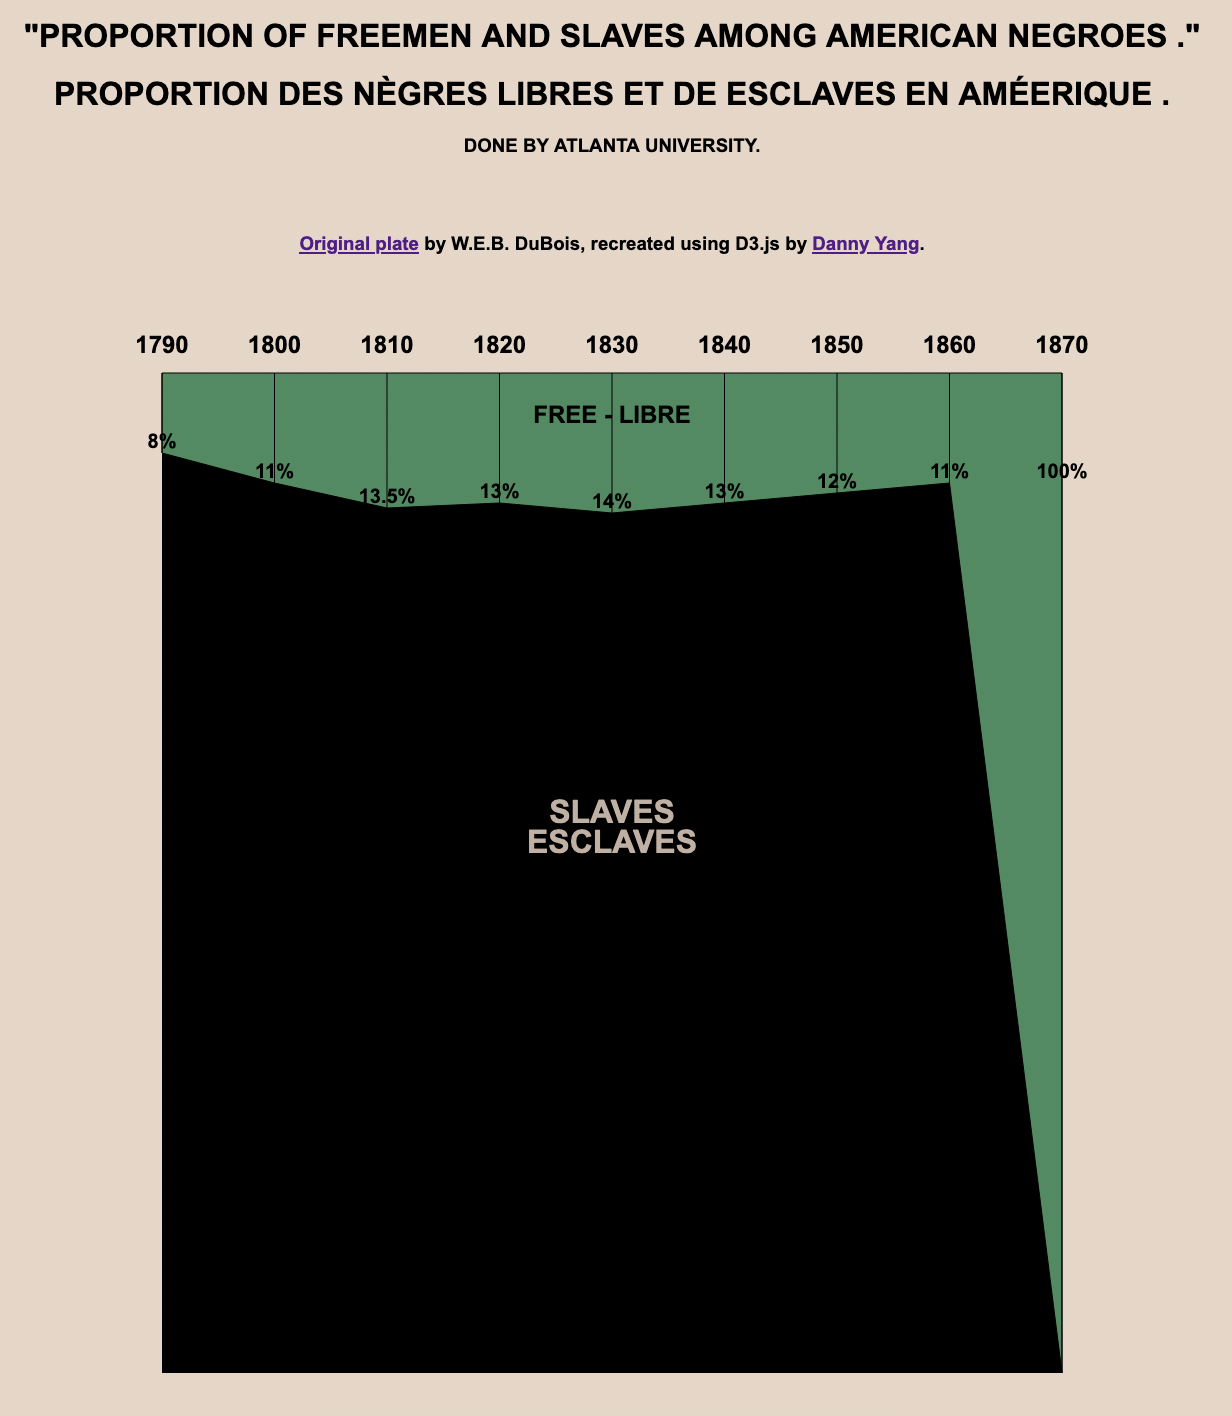
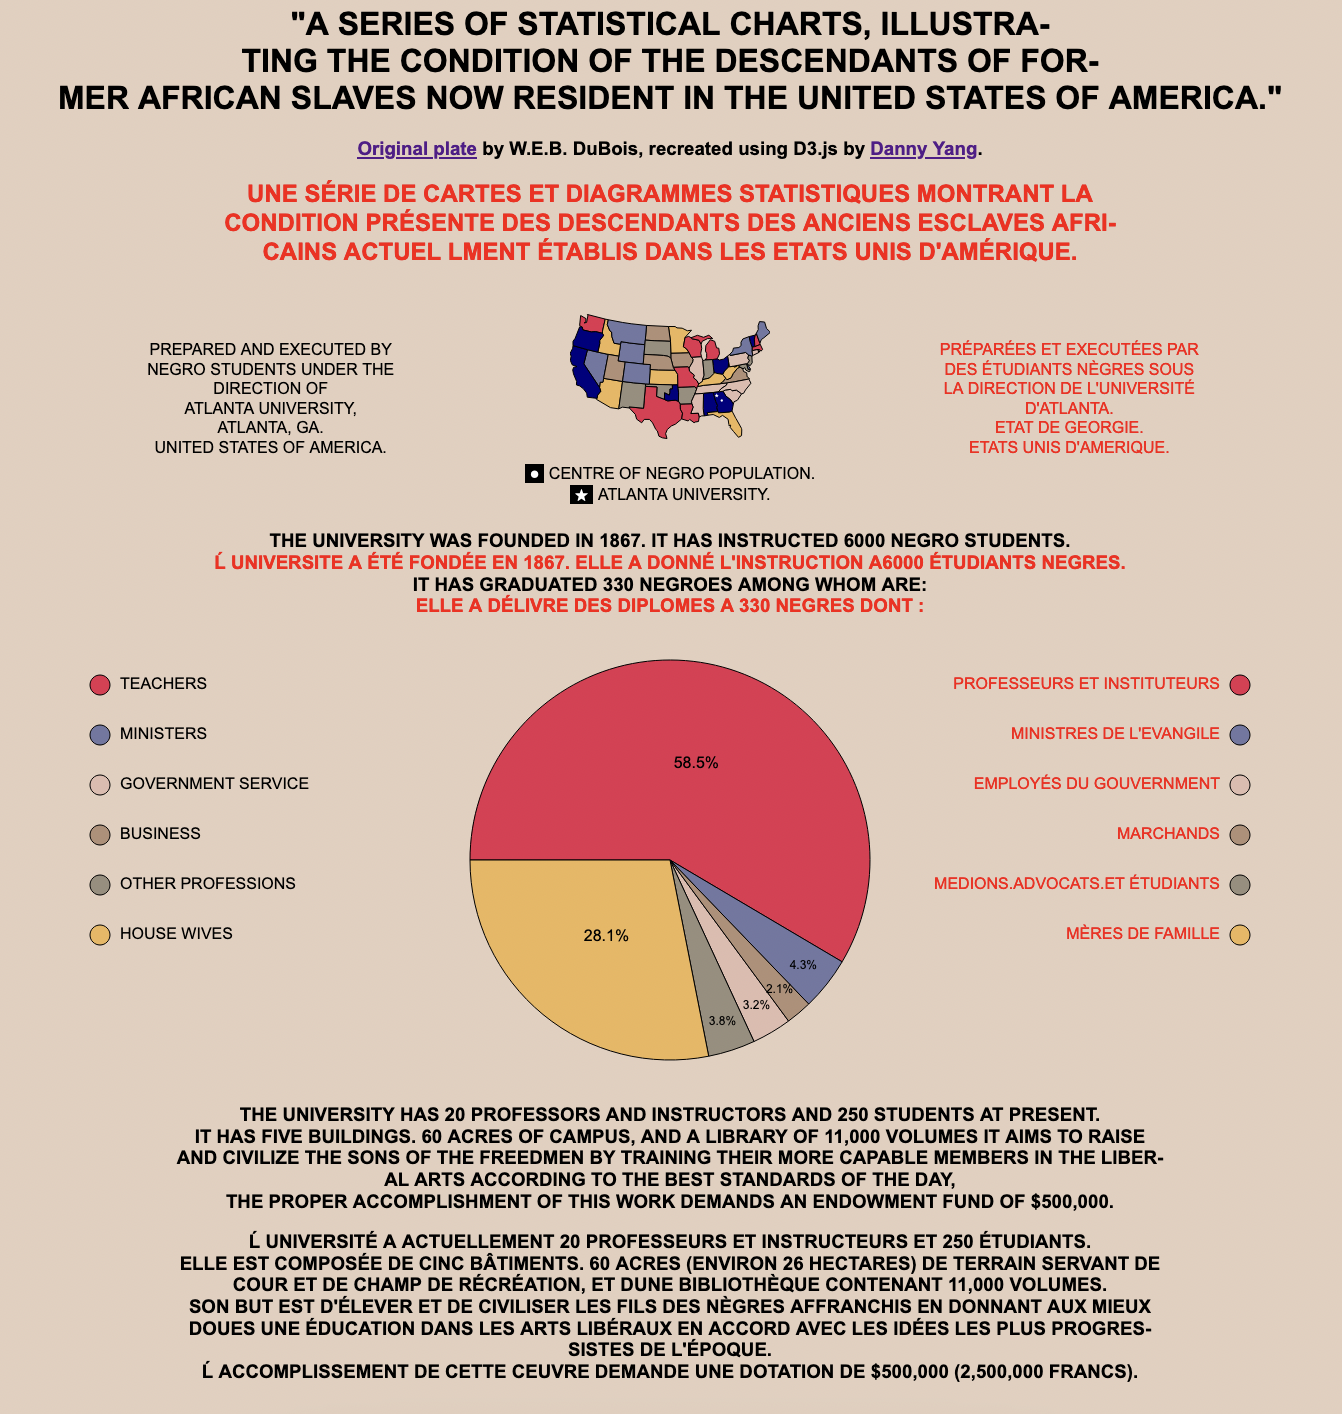
The Du Bois Challenge is is an annual challenge where data vis practitioners are tasked with recreating one of W.E.B Du Bois's famous data visualizations each week over the course of 10 weeks.

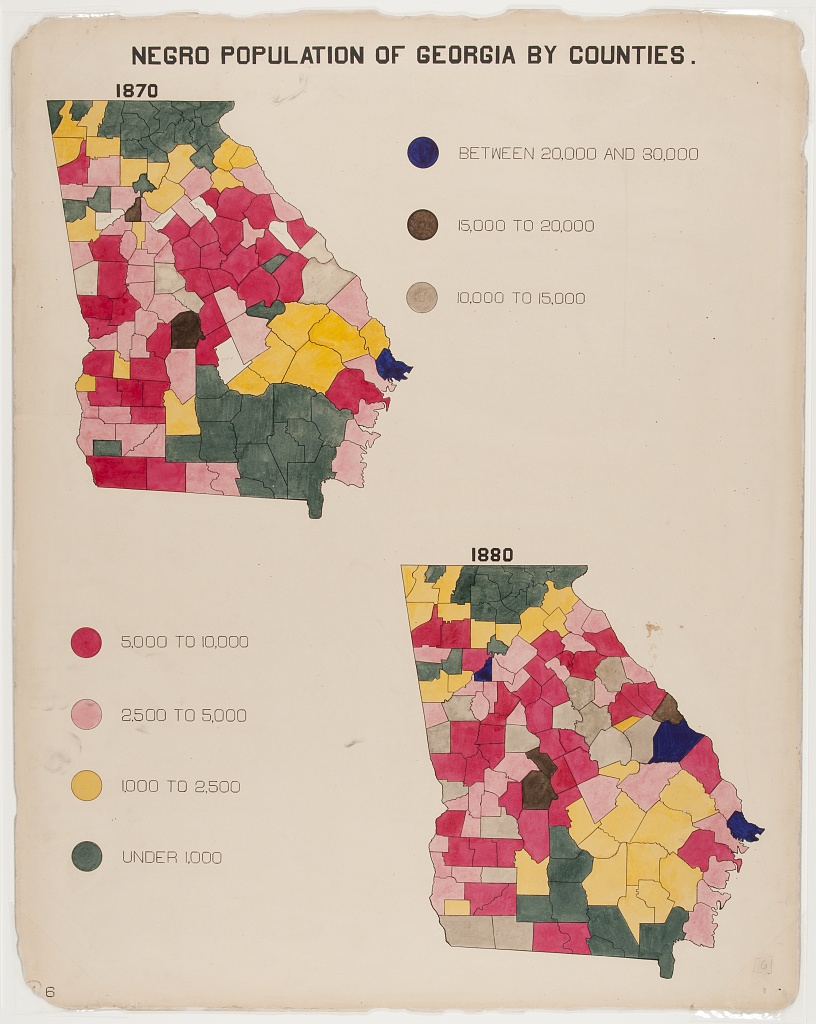
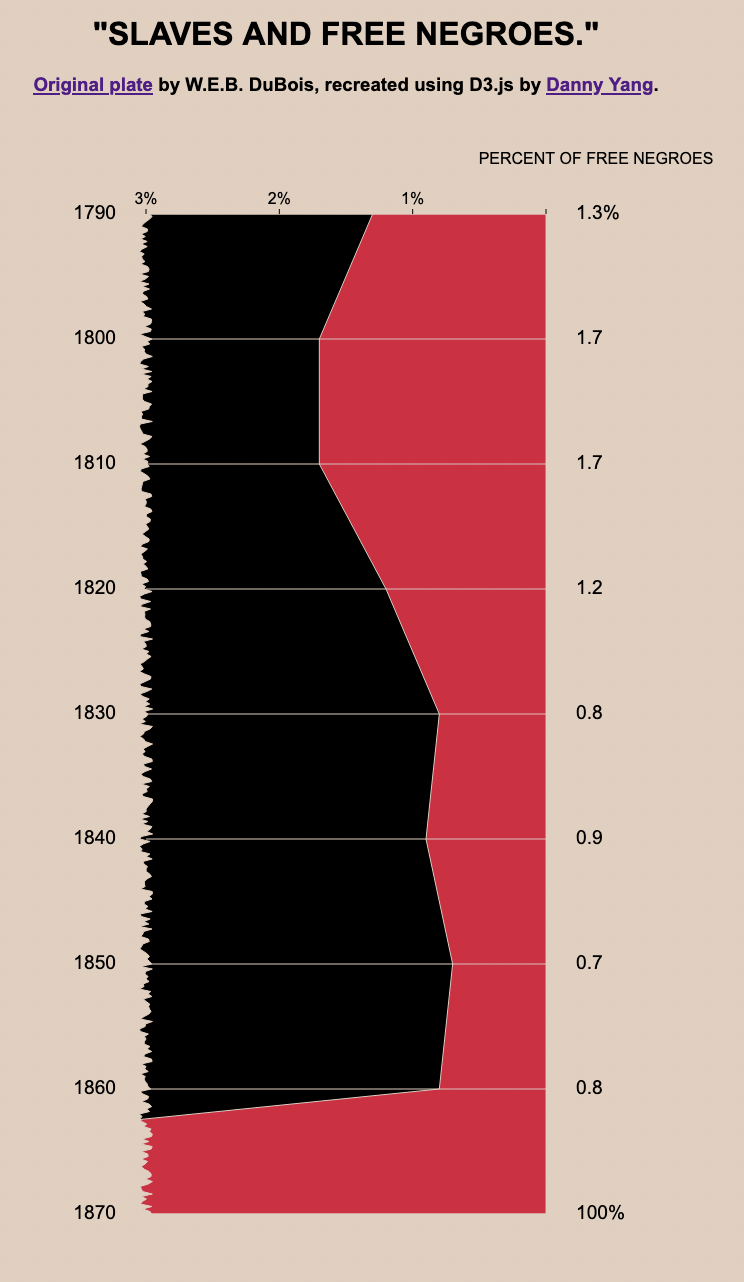
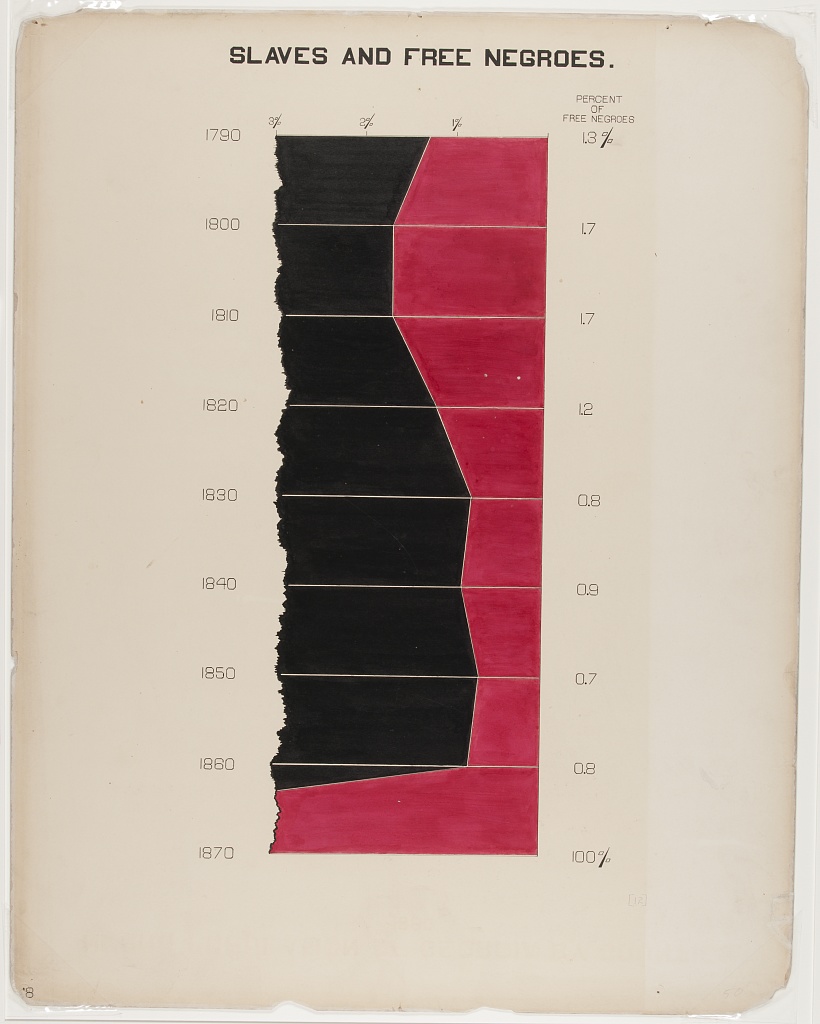
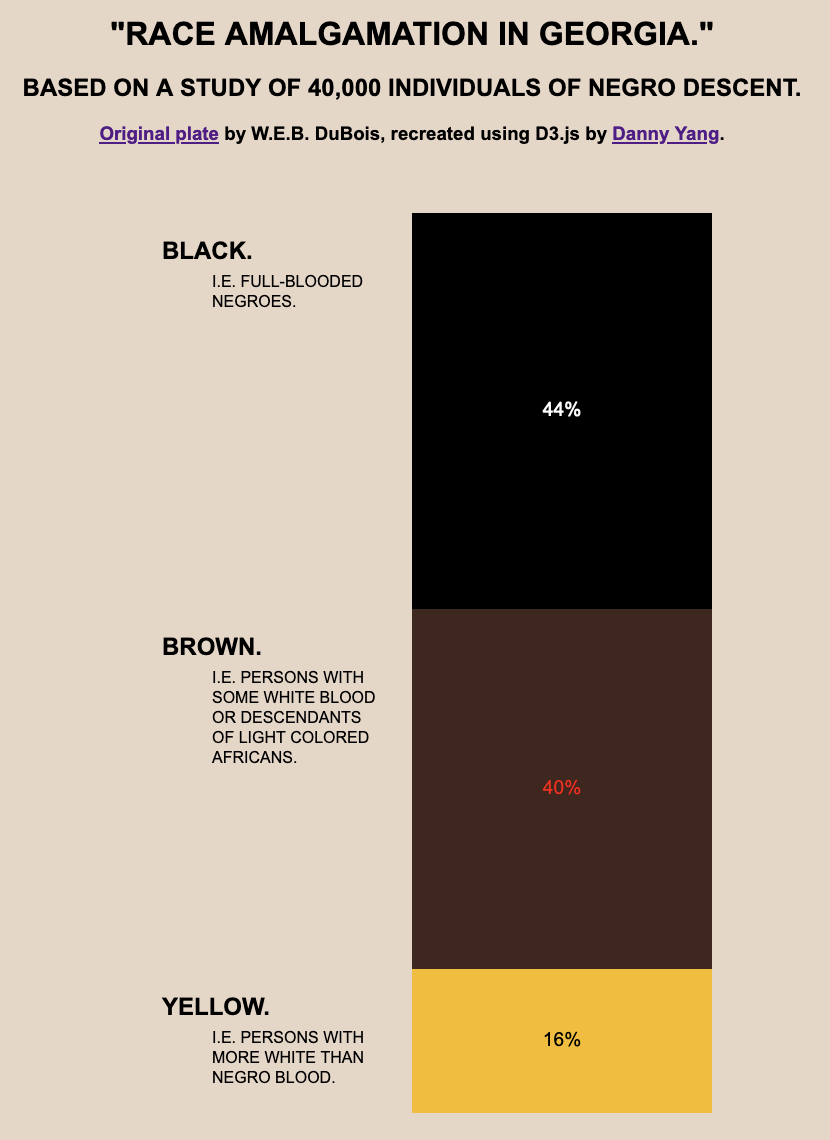
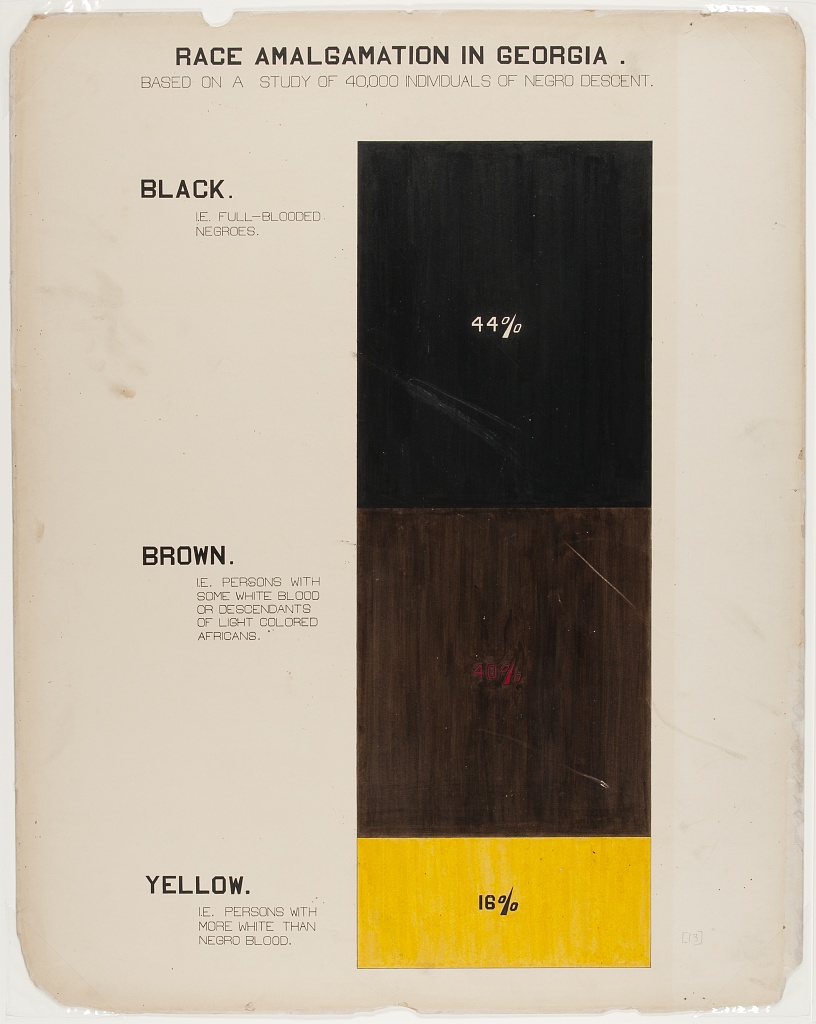
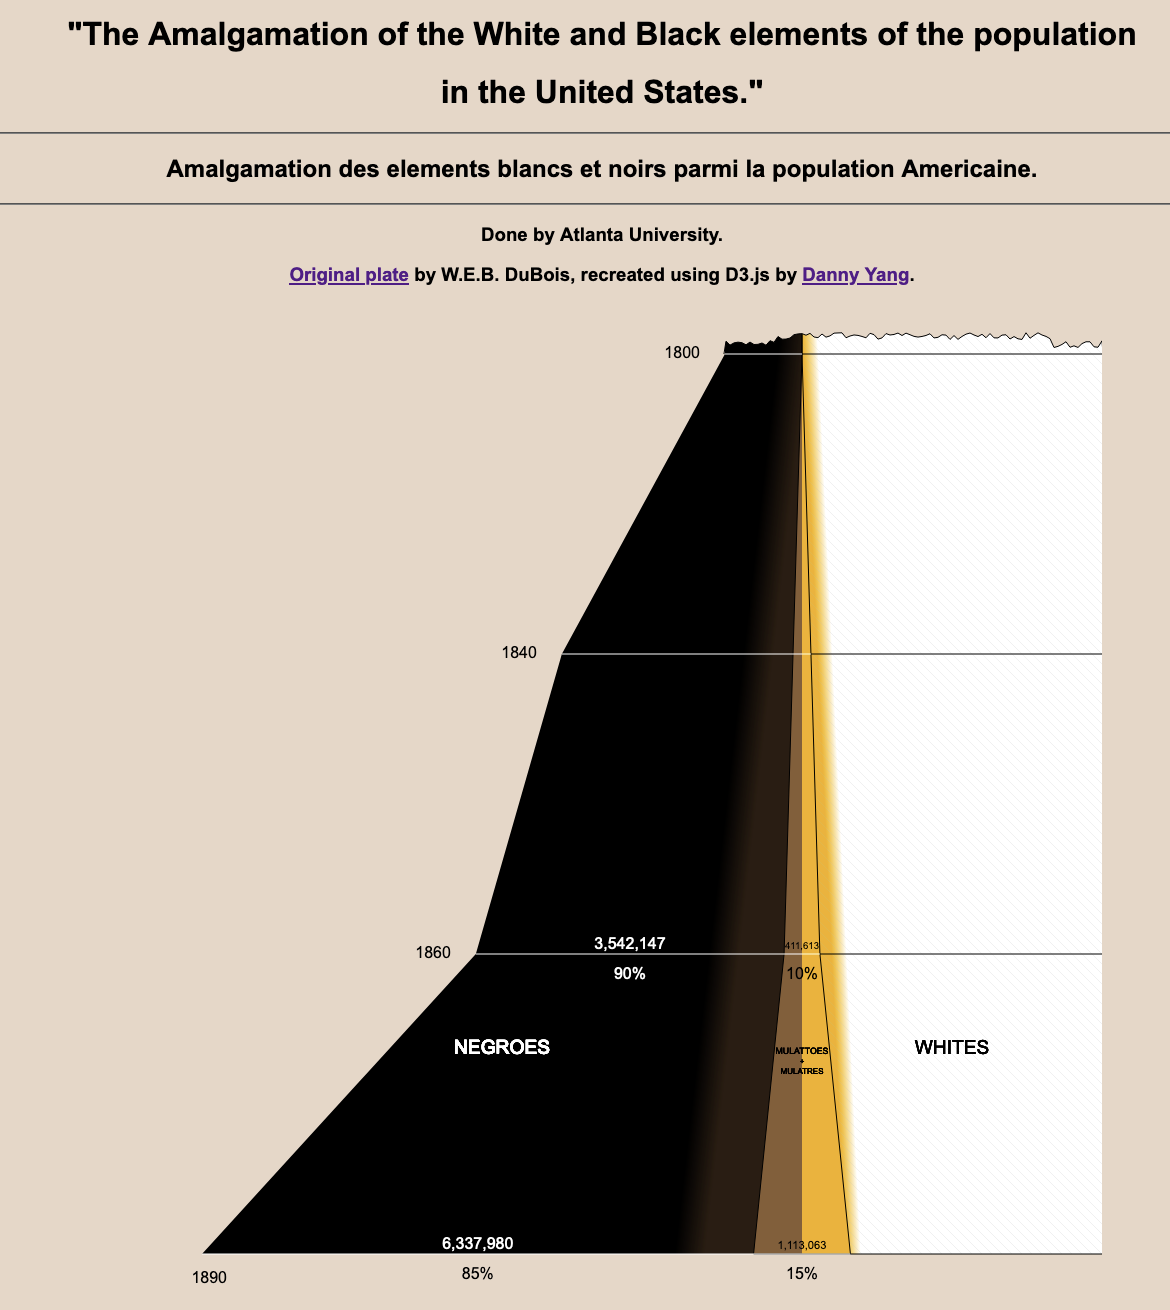
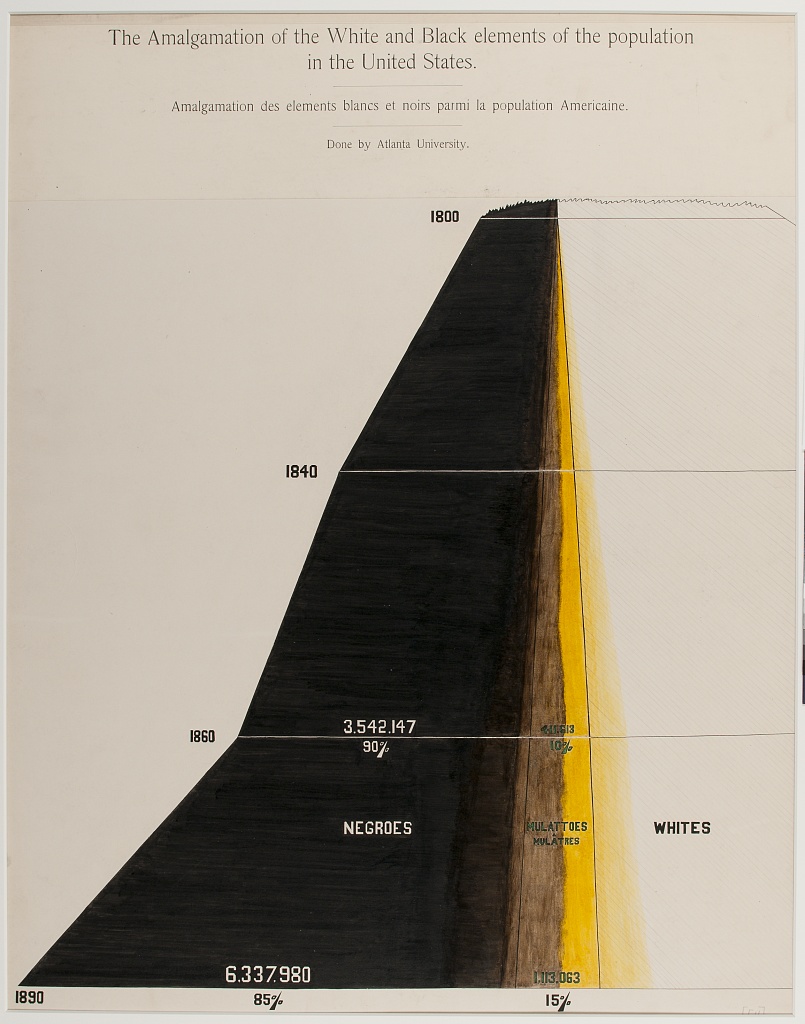
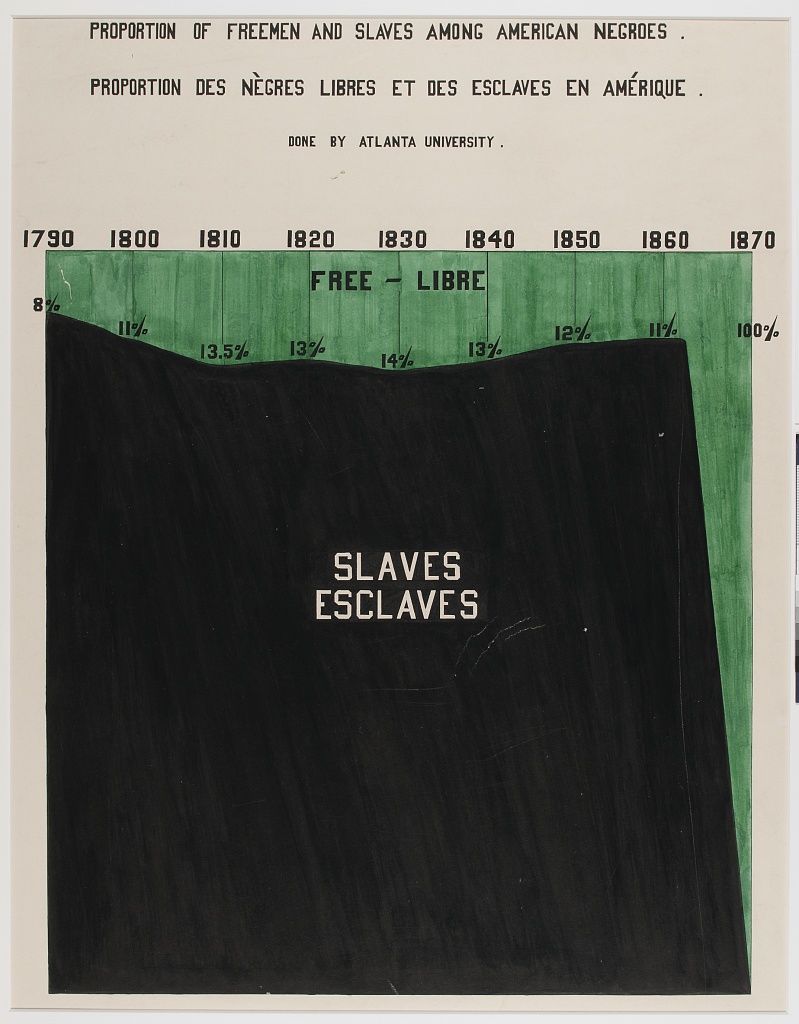
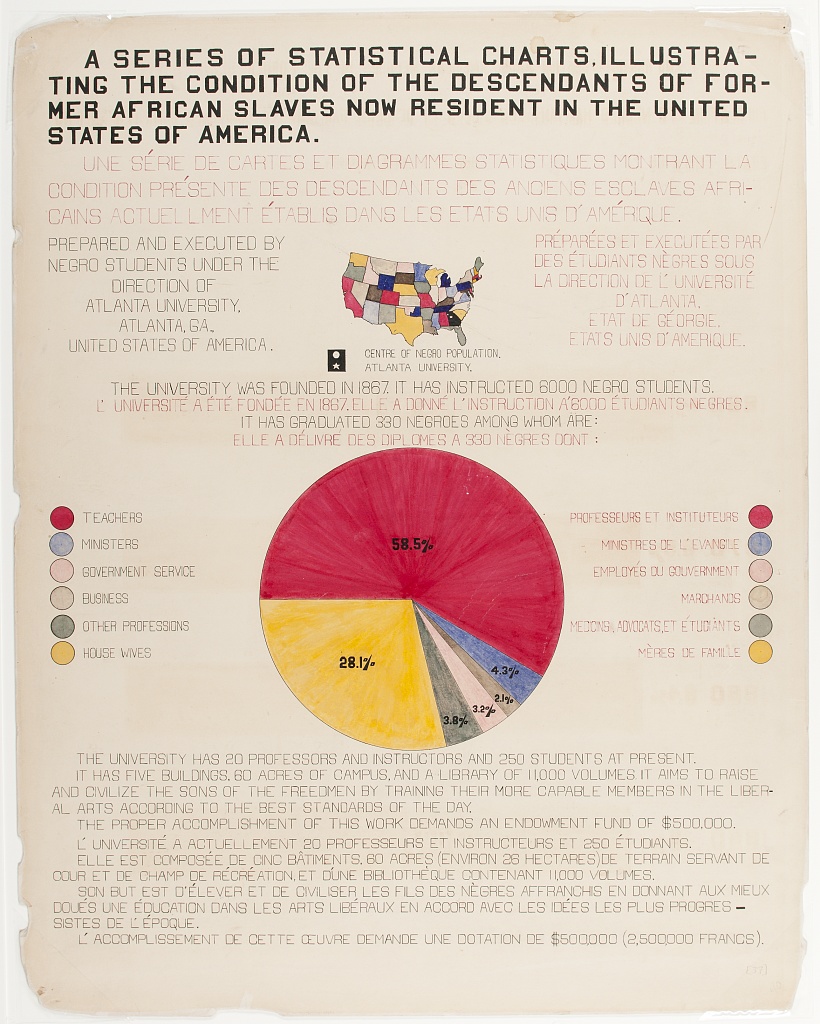
In the images below, the reproduction is on the left and the original is on right. Click the title of each chart to view the full version. Source code is available here.

  1. Week 1 - Plate 06
    Plate 06 reproduction Plate 06 original
  2. Week 2 - Plate 12
    Plate 12 reproduction Plate 12 original
  3. Week 3 - Plate 19
    Plate 19 reproduction Plate 19 original
  4. Week 4 - Plate 01
    Plate 01 reproduction Plate 01 original
  5. Week 5 - Plate 13
    Plate 13 reproduction Plate 13 original
  6. Week 6 - Plate 54
    Plate 54 reproduction Plate 54 original
  7. Week 7 - Plate 47
    Plate 47 reproduction Plate 47 original
  8. Week 8 - Plate 50
    Plate 50 reproduction Plate 50 original
  9. Week 9 - Plate 51
    Plate 51 reproduction Plate 51 original
  10. Week 10 - Plate 37
    Plate 37 reproduction Plate 37 original